There are some signals which is what I was hoping to see with market movement, now to determine how much weight to give them considering length, where they occurred, the massive op-ex / rebalancing of Friday, etc. Also the fact that not all averages are in agreement, lets take a look, I do think it's enough to warrant dialing back risk a bit in either direction except on trades that you really like, for me that might include FB, PCLN, UNG etc.
Looking at the SPY and S&P E-mini Futures (ES), here's some newer signals from today or recently.
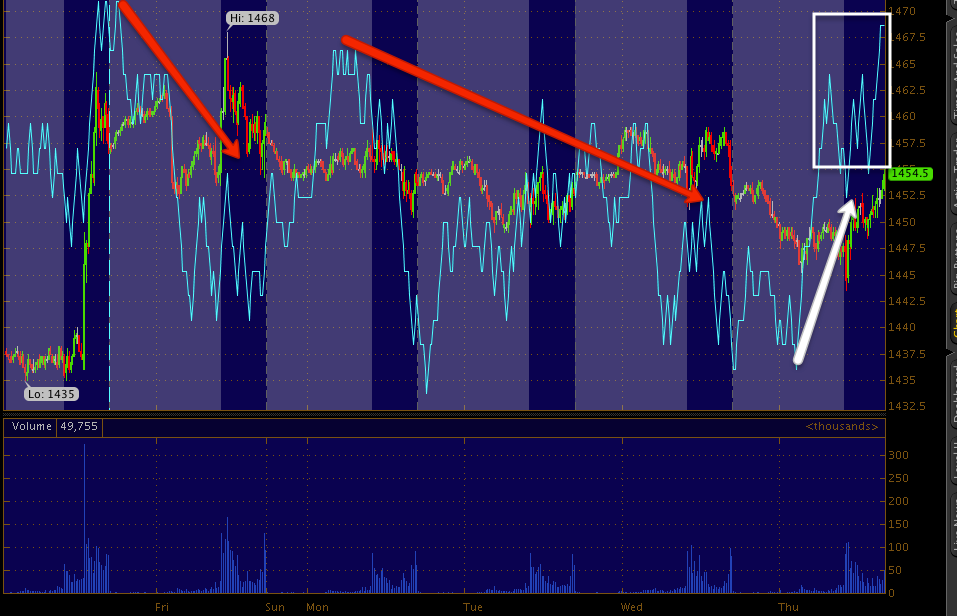
SPY 15 min within the context of the trend gives a clear negative signal, the character of trade has changed from decent confirmation to a leading negative divergence.
However if we look since only post F_O_M_C, then we have a leading negative divergence bringing prices lower on the same chart, a small positive divergence, lifting prices a bit and then a good size relative positive divergence on today's open with a leading positive since. What troubles me is the 15 min positive developed almost overnight based on 3C moving in line with price, yet it's still a signal that should be respected and part of our analysis.
The 60 min chart has a leading negative divergence with a small relative positive at today's gap open. Normally I wouldn't think too much of it, except when looking at the 15 min chart just above it.
The 4 hour trend leaves nothing to the imagination, it's clearly leading negative and very bearish, the question remains though, did QE3 force a reset of longer term charts or was this priced in by smart money?
Turning to ES / S&P futures
The 5 min was negative at the recent tops here that bumped in to the upper VWAP, they signaled a negative divergence and price responded overnight. Fair enough.
The 15 min chart isn't so different from the SPY 15 min, negative up front since QE3 announced and a relative to leading positive today on the exact same timeframe.
The 30 min is clear in the trend, negative at the recent high and leading negative since, even though this incorporates some pre-QE3 trend, the majority of the leading negative divergence happened after, this is hard to ignore.
The 60 min chart shows a negative trend/signal right at QE3 highs and remains leading negative since. Again, even taking out the pre-QE3 data, the leading negative divergence is still in place since QE3.
The daily chart is clear on the long term trend just a the SPY 4 hour, very negative, but again the question we are trying to answer is whether the longer term data is still valid, that would mean QE3 was priced in and becomes one of the largest sell the news events for equities we have seen in years, the divergences are on that same level of intensity. Or did QE3 force a re-start and we need to ignore longer term trends and focus on all new information post QE3?
We are now getting information that will ultimately give us the highest probability so at least that is making itself available, now we just have to see some consistency and get around some events that have an artificial pull on the market such as everything happening Friday.


No comments:
Post a Comment