I like BEAV here especially because the potential reward vs the risk is very attractive. This is a core short and will remain.
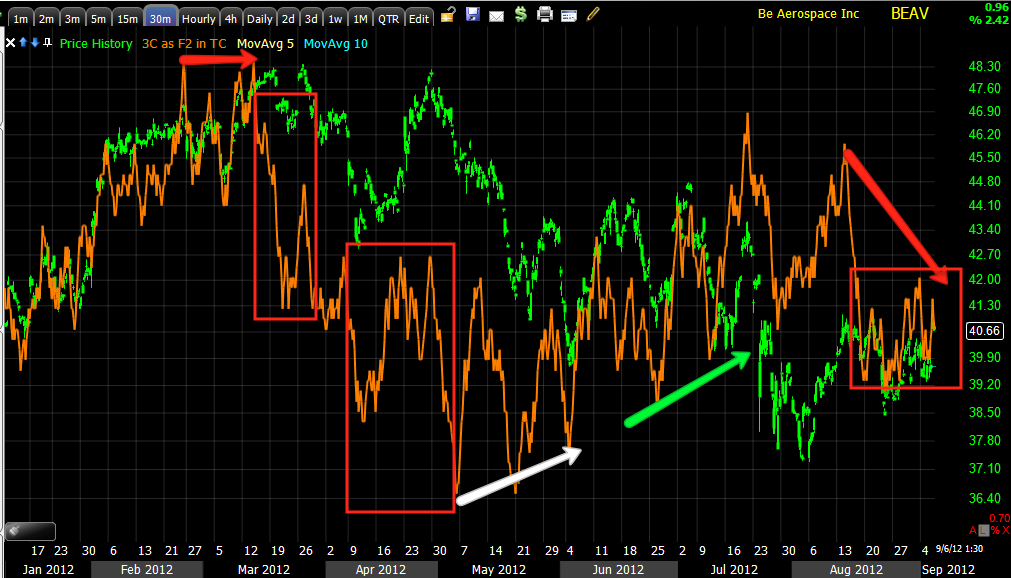
This is why we either try to short at head fake moves or near the top, conventional Trader wisdom is to short the first break of support below a top pattern, we have seen this volatility shakeout so many times that we almost never short the first break, but wait for the volatility shakeout. The red arrow is around the time and at the price level BEAV became a core short.
The Trend Channel has held decent moves in BEAV and has a stop that is only about $1.20 away, I'd still consider position sizing, the 2% rule, etc, but the less the risk, the easier it is to work with the position.
MoneyStream Daily leading negative on this consolidation
The longer term chart with large accumulation at 2009 lows, leading negative daily divergence and a top that hasn't even really began its move yet. The measured move gives BEAV a ridiculously low target of about mid-teens eventually.
The 30 min chart with the counter trend move and what looks to be a failure at the local triangle.
15 min chart has been tracking BEAV in confirmation near perfectly, there are some smaller divergences not marked, but the top and the current leading negative are the two largest.
Short term intraday, you could even wait for a break down in price, you wouldn't be giving up much on the profit end, just a little on the risk end with a slightly smaller position size if you are using a 2% type rule.


 | Theme by Thur
No comments:
Post a Comment