This is a pretty big update, I'll try to keep comments to a minimum, I through in the occasional trend chart so there's some context to the intraday charts (today). We've seen confirmation in a number of long stocks, earlier today FB was an example so that's what you should see as prices move higher, when there's a lower 3C reading, there's less money flow in to the issue, more out of it, that's the simple idea of it.
DIA 2 min trend already leading negative, no confirmation at all.
the same chart intraday close up. Note when the divergence picks up, price stops and is flat, there's no short term buying pressure to move it higher.
DIA 3 min intraday shows a small acc. area.
DIA 5 min trend
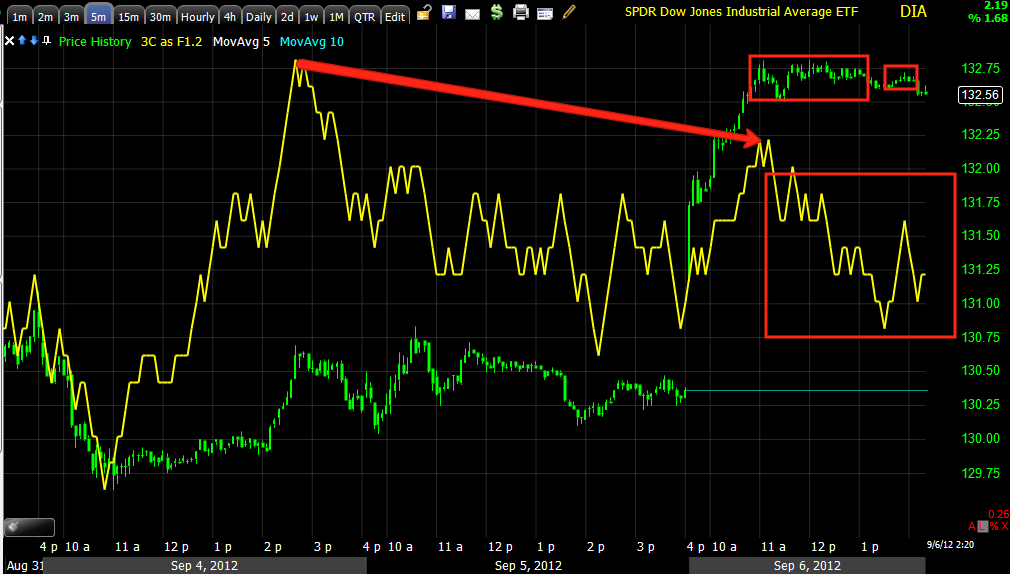
DIA 5 min intraday
DIA 15 min trend, remember the break above the downtrend line was set up before hand with a positive divergence to the left, currently leading negative.
IWM 1 min trend, green=confirmation, meaning expect that price trend to continue until divergence interrupts it. This is a bad leading negative trend now.
IWM 1 min intraday
IWM 2 min over several days
IWM 2 min intraday.
IWM 3 min
IWM 5 min
QQQ 1 min, remember the breadth in the NDX today.
QQQ 1 min intraday
NASDAQ 1 min intraday mini futures.
QQQ 3 min intraday
QQQ 5 min trend
QQQ 5 min intraday
NASDAQ Futures 5 min with an intraday leading divergence
SPY 1 min trend
1 min intraday
2 min intraday

3 min intraday
SPY 5 min intraday


No comments:
Post a Comment