These are some of the ugly charts I mentioned in the last post, it's amazing how fast they turned down and how deep. I would imagine we could see a week of upside and still not undo the damage that has been done.
Short term divergences may bounce the market and price may even move toward an area that doesn't look that bad, but the underlying damage done here and especially after Q3 ended, it seems they were just waiting.
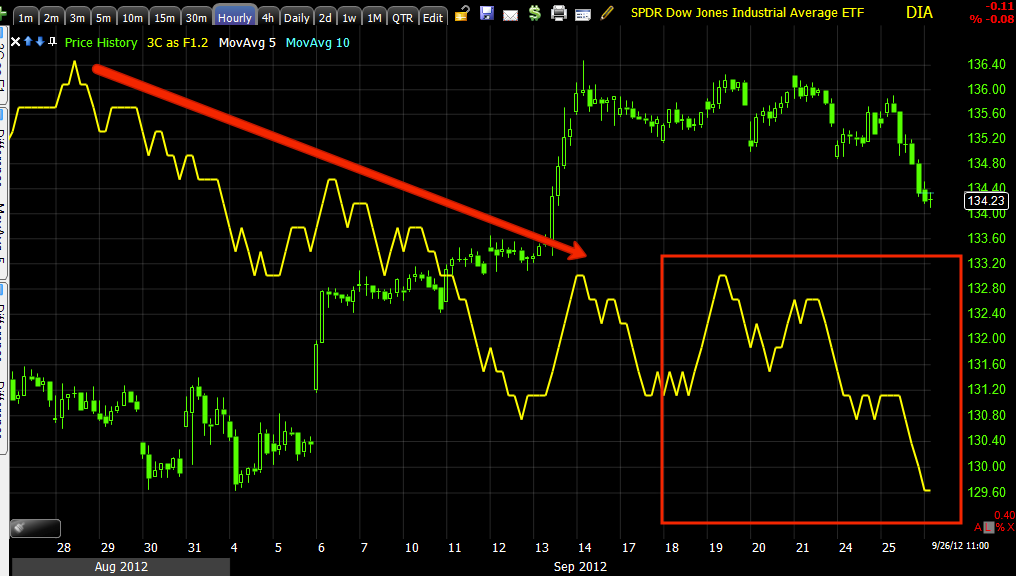
DIA 30 min leading negative-for a chart this long (30 min), a leading negative divergence is a very serious signal.
DIA 60 min chart looks even worse , also leading negative.
IWM 5 min is in a relative positive right now between the 20th and present, but that is within a leading negative divergence which is much stronger.
IWM 10 min a new low leading negative.
IWM 30 min also a new leading negative low.
IWM 60 min is really ugly with a new leading negative low. Price is nowhere near as ugly as the underlying trade, yet.
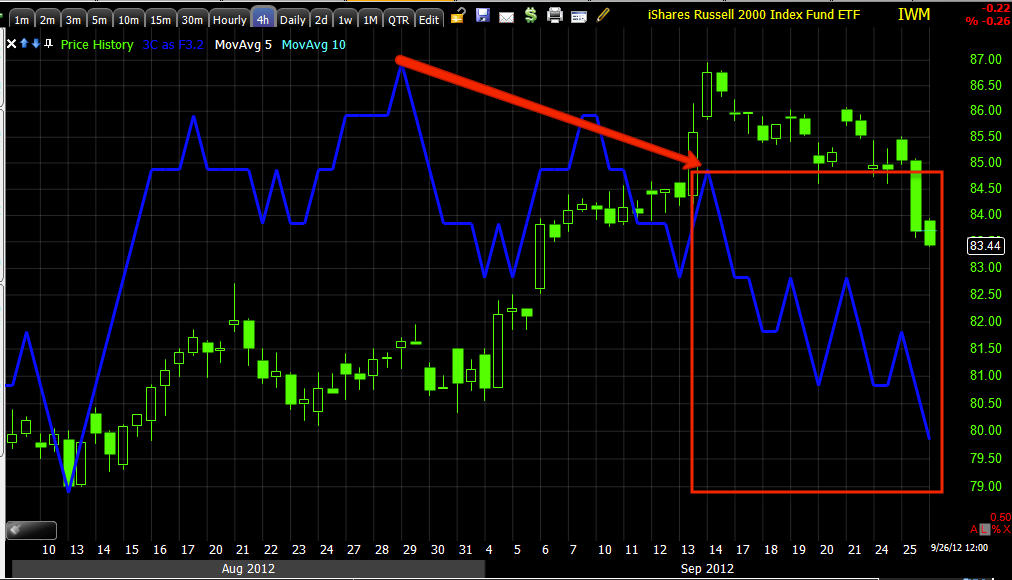
Even the IWM 4 hour chart is leading negative in this short space.
QQQ 10 min at a new leading negative low.
QQQ 30 min leading negative.
QQQ 4 hour leading negative
SPY 10 min at a new leading negative low.
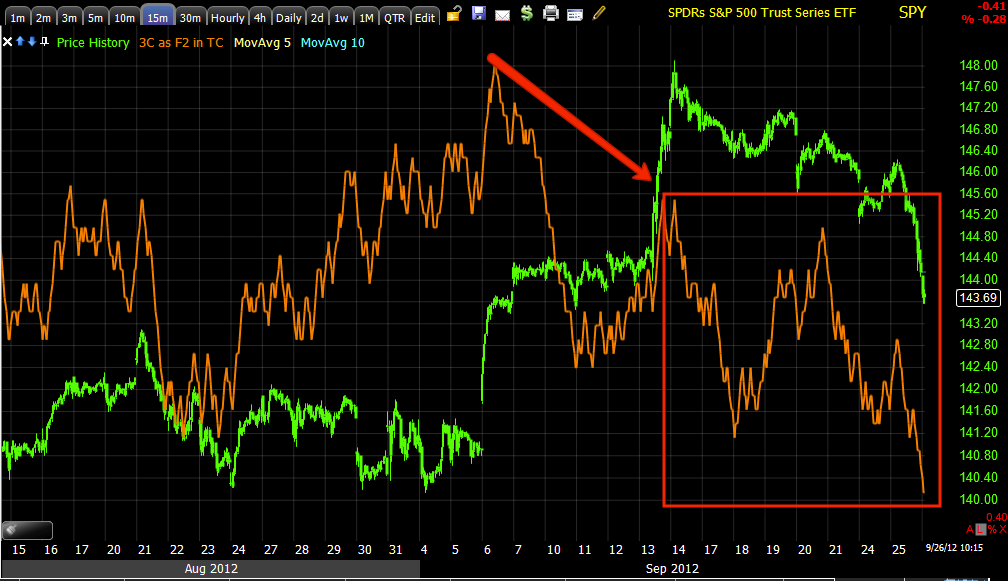
SPY 15 min also at a new leading negative low.
SPY 60 min again a new leading negative low.
There's a lot of damage to the charts that's not yet reflected on price, even with yesterday's S&P largest drop in 2 months.


No comments:
Post a Comment