So far today it is the second option, rather than a quick upside bounce, it looks like the lateral action today has helped build a larger positive divergence, although there's nothing that looks spectacular. More than anything, I'd think a risk on move in Energy would see the rest of the market draft that move.
Here are the charts for the averages and Futures...
The DIA was pretty difficult to find much of a positive signal in, taken alone I would call this divergence support, simply enough to keep the DIA from falling further as there are two ways to consolidate, through price corrections and through time (lateral price patterns like triangle, rectangles, etc.
As far as capping any positive momentum, the 60 min chart's very fast leading negative divergence puts a large road block up.
The IWM too was difficult to find the kind of positive divergences I would expect to see after today's price action, there's this 3 min leading positive, but again - taken alone and after yesterday's momentum down, a divergence like this could be used just to provide some support and halt the slide.
The IWM 10 min shows a little better positive divergence more along the lines as far as timeframe.
The IWM 60 min's deeply negative posture seems to cap any extremely bullish hopes for now.
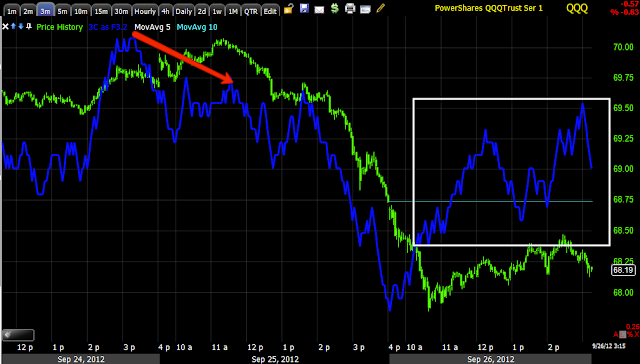
QQQ, again not a strong signal as a 3 min leading positive, however I would say we have simply been building today so the upside response to the divergence hasn't started so I'd expect that either to start near the close or perhaps tomorrow unless an even larger divergence is built which I tend to think is nor as likely.
QQQ 5 min leading positive is reasonable, but still not overly impressive.
SPY 5 min is probably one of the better looking positives today.
Even the 15 min chart though caps any positive developments, but I will note the momentum accelerating to the downside yesterday along with the dominant theme of the Price/Volume relationship from yesterday both suggest a short term oversold condition exists.
ES 1 min looks pretty good.
ES 5 min look ok, I'd think the market could get a decent bounce from here.
NQ 1 min is about as impressive as the QQQ divergences, not very.
However the 5 min chart has been building since last night and this looks more along the lines of a volatile move.
There's little reason to lift the market if it doesn't move traders emotionally, meaning get those who were long and stopped out back in the market or those who went short to cover, there's almost always a reason to what Wall Street does and why. So although I don't see strong evidence of a strong bounce, I would expect one just from a behavioral point of view.
This does open up some possibilities and opportunities to enter some positions as the trades come to us, however at the same time I want to monitor the QE3 aspect of all of this. I need to see 2 things, a downside move and an upside move to gather the information that gives us the probabilities. Thus far on the downside move, we aren't seeing large accumulation of lower prices so the data so far suggests QE3 was already priced in and the market is more worried about the real economy and events.
A move up will tell us whether the higher prices are confirmed or under distribution as they move up, if they are under distribution, then that matches with what we have seen thus far and suggests QE3 was priced in and it i likely the long term charts from last night are still reliable and most likely the underperformance in hedge funds comes as they have been building short positions in to higher prices in expectation of a nasty move down, which also seems to fit with the opinion that unless Bernie knows something we don't, then he seems to have panicked. I would guess 11 members did not make this choice lightly and it would be likely there's something we are not aware of that the F_E_D is trying to get in front of, something not so good.
Is interest rates about to start going up?
-
Yes, I know - it does not make any sense - FED is about to cut
rates...but....real world interest rates are not always what FED wants it
to be.
6 years ago


No comments:
Post a Comment