You may recall I closed a USO short I believe it was the 19th of September and entered an ERX long position (Energy 3x Bull), which is not the same as specifically being long oil as Energy is much broader including other forms of Energy and multiple services.
USO has been given some signals that it's looking for some upside, the question is how much? This is one of the best examples of the conundrum of QE3, oil should have rallied, but we have a macro-fundamental environment in which demand should be stifled as manufacturers are in contraction, transports are as well and the average consumer is seeing high inflation in gas and food. The other situation, just to make this as complicated as possible is the geo-political environment from Al Qaeda attacks on US diplomatic missions, to China/Japan/Taiwan all fighting over 2 barren rocks in the middle of the ocean, there's also the Syrian and Iranian problem with an armada of 25 nations amassing in the Straits of Hormuz and there are violent protests that are springing up around Europe and not to engage in hyperbole, but the last 2 World Wars and particularly the second, were not only on the very same continent, but also after a period of social/financial unrest that was used to turn citizens in to national zealots to take the focus off the failing of the domestic government in dealing with structural issues such as 50% youth unemployment in Spain; it's a wonder they haven't already burnt half of the country to the ground.
As for USO/ERX, I feel good about the long ERX position and am interested in what effect, if any QE3 has on the underlying trade of oil, thus far it hasn't been good.
I originally went short and kept USO short as it failed to hit the upper channel and subsequently broke down, however while this looks like a textbook short set up, these textbook set ups almost always see volatility shakeouts which is why I prefer to either short at the top or wait for the volatility shakeout than short in an area like this.
The odd behavior in all assets, but oil since QE3.
The 60 min USO chart shows several distribution areas, the last at the QE3 announcement.
USO 2 min shows some intraday momentum in 3C picking up.
The real positive divergence though has been on this 5 min chart.
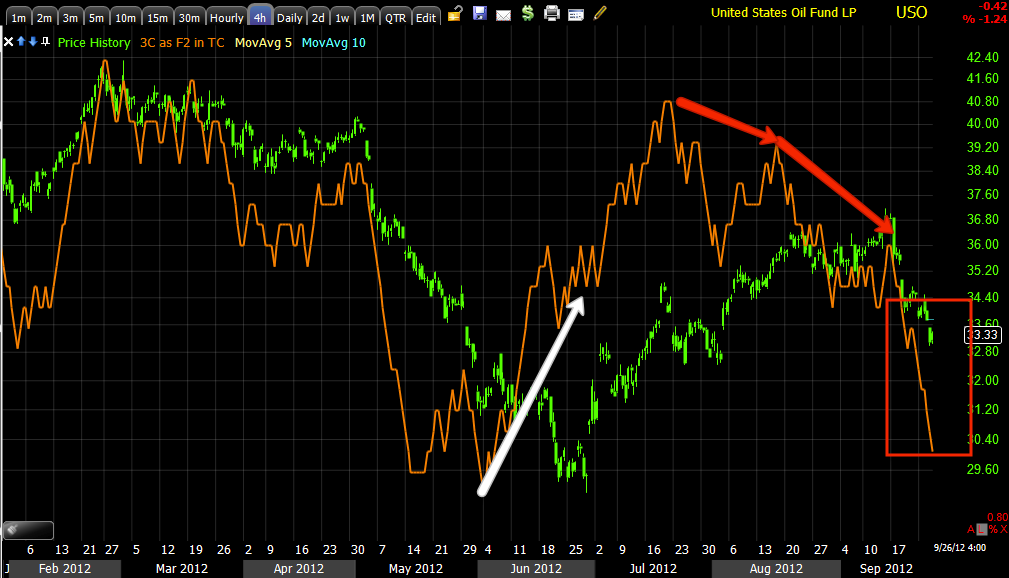
The 4 hour chart or the big picture would seem to cap off USO's probabilities of a large run to the upside along the lines of normal QE price inflation, but I'm open to any data that suggests probabilities are otherwise.
In ERX, 3x long Energy, the 4 hour chart is similar to USO's, deeply leading negative and especially so at the QE3 announcement. Compared to the last negative divergence in March-May 1, this one (currently) is far, far worse which would imply a spectacular move lower in ERX/Energy. We'll see how they react on any upside, if there's strong distribution in to higher prices, this may be one of the best opportunities we have seen since March of 2009.
ERX 60 min also looks like USO in not only the positive sending it higher, but the recent negative leading divergence.
ERX near term 3 min chart is leading positive so I suspect both USO/ERX and Energy more broadly are about to see a decent upside bounce, which brings us to other risk assets which I will cover next.


No comments:
Post a Comment