The last time we were long FB it was at its lows and made a great move for us while it was the most hated stock out there. The divergences at that time were so overwhelmingly strong, I couldn't ignore them no matter how I felt about the stock. That long position with Calls was exited for a nice profit, some of you held longer and made even more, but since that day I have just been patiently waiting for the next opportunity to come up in FB which is a unique stock in that it moves with very little to no market correlation.
So we got a second chance with FB and similar to UNG (although not to the same degree), I think patience will pay off in FB, although unlike UNG I don't see it as a long term secular bull trend or primary bull move, but certainly more than enough to warrant taking a shot with it.
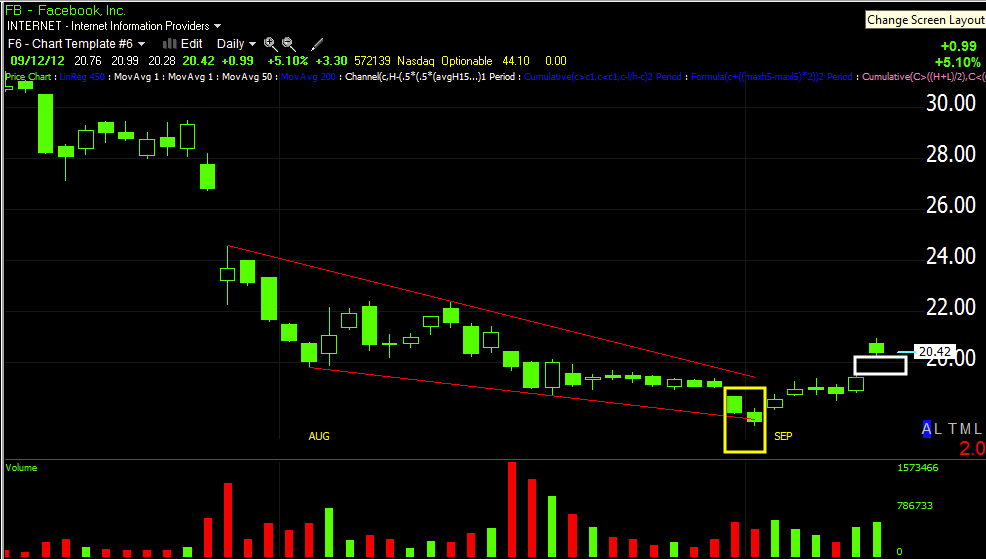
After this morning's gap of 6%, FB is holding on to 5+%. I'm not crazy about the gap as the market has been diligent about filling them this year, but even with a gap fill I'd have a very hard time letting go of FB without some real chart evidence or the daily Trend Channel stop being broken as FB looks to have carved out a bigger base this time and has even better signal/3C positioning than it did at the 6/6-6/26 run.
This head fake behavior is seen so often that it is just about as reliable as anything out there, not only was the wedge taken out, but 2 weeks of support, 1 day later the character changes completely. In white is today's gap, breakaway gaps just aren't that common any more (Thank you HFTs) so if the gap is filled, it wouldn't be anything that would surprise me or concern me; some may even be able to use it for positioning.
There's an obvious change in character in volume as well.
This is really what seals the deal for me unless something comes along to contradict this 4 hour chart that started going positive EXACTLY where I first said we'd have a small move up, but chances were high that FB would form a larger base to support a more sustained move higher. Right at the head fake move/new lows, the 4 hour chart goes in to a leading positive divergence which we see so often, I think the reason is obvious if you think like a trader responsible for putting together a large position that is to your benefit. If you think like a trader working with 100 lots, than it becomes less obvious.
The 60 min chart shows th original long position to the left and the base for that in the small green box, compare price then and now and 3C levels then and now as well as the apparent size of this base vs the last.
On a 5 min chart, as soon as the new low move below 10-days of support is made, the indicator is leading to the upside in a big way, think about what happens when a new low or 10 days of clear resistance are taken out and how a large trading firm would or could use that to their benefit.
On intraday charts there's decent confirmation, I don't rule out a gap fill, but even if one comes, I don't see any reason to fear it.
Finally we just got enough data to put together a daily chart, we don't see too many leading positive divergences on daily charts and especially not this quick and at the same break down low.
As mentioned, unless the charts change substantially or this stop is broken (and still the charts would have some bearing in my decision there), I see no reason to be anything but patient with FB.
Daily Trend Channel...
So FB is another example, as it was the first time, in which the hard emotional trades to make are often the least risky and best performing.


No comments:
Post a Comment