In yesterday's GOOG update, as price action develops the probabilities change as to what the catalyst or tactical move will look like and where you want to watch for best positioning.
Yesterday I described how GOOG reminded me a bit of BIDU, although I could cite numerous examples of this kind of set up, BIDU stands out as it was very clear, it happened twice and both trades were very successful. What I'm talking about is negative underlying action and BIDU forming price patterns like a bullish continuation triangle and a very clear zone of resistance, both were predicted in advance as head fake moves and the price strength/eC weakness allowed us to get near perfect positioning less than 1% away from the very top and the second trade probably a fraction of 1% away from the absolute highs, this gave us a better entry, lower risk considerably and increased odds without having to sit in BIDU and wait for it to turn which would have brought account draw-down, unnecessary market risk and opportunity cost.
While GOOG is different, the concept is the same and today's move in GOOG may not be exactly what it appears to be.
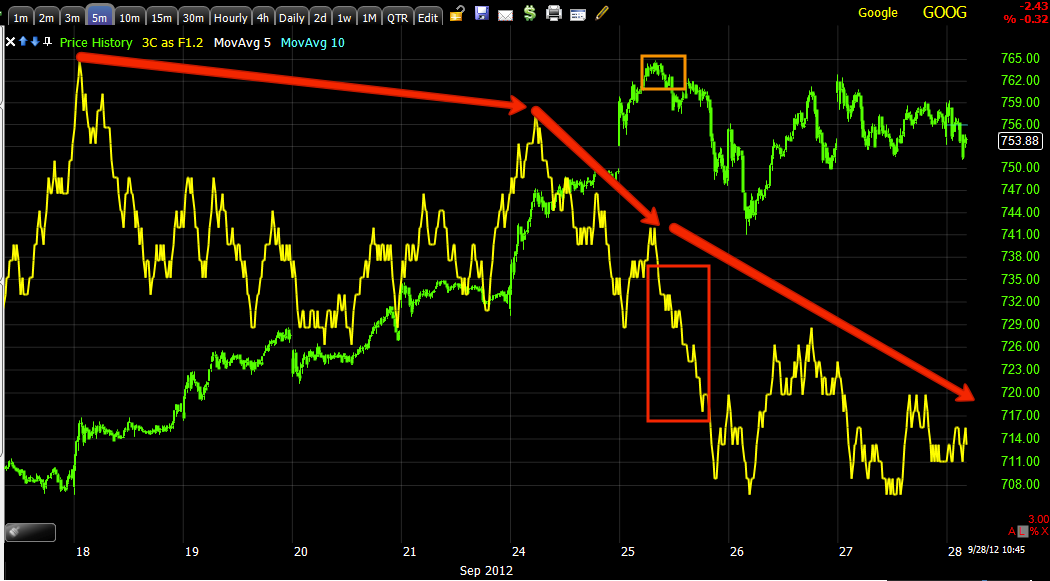
GOOG started showing noticeable underlying weakness on the 24th, it got worse on the 25th and then went on to form this bullish price pattern, a consolidation/continuation triangle, similar to BIDU. You can see yesterday's post linked above for more details on the price pattern and how it has been used many times to create bull traps and send stocks lower quickly, BIDU and PCLN both saw this among our core shorts.
The 5 min 3C character changed dramatically on the 24th and even worse on the 25th, I mentioned on the 25th as price was near the highs that you might consider phasing in to a short position as the risk at that area was much lower with a stop just above (although not at resistance where all traders will place orders, it's too obvious). Since, the 5 min chart has continued to lead negative.
There's a marked change in character on the 15 min chart which is an important timeframe and the 30/60 min charts which were rock solid are showing cracks.
On today's dip below the triangle seen at the first chart above, there's a short term positive divergence making this a higher probability head fake move, some traders may short this or sell, although volume hasn't picked up much to suggest they are yet, but this very well could be part of what we call a Crazy Ivan Shakeout in which a triangle like this is very easy to shakeout to the downside and upside as the narrow apex doesn't require much price movement to accomplish either move.
Here's the break this morning below the triangle, seemingly bearish, but I'd be on the watch for a move to the upside and that's the move we want to look at very carefully and see if the charts still are negative on such a breakout which traders will buy, which gives institutional money the demand they need to sell short in to and set a bull trap which will help with downside reversal momentum a bulls are caught in a losing trade and overwhelm demand with supply as they sell losing positions.


No comments:
Post a Comment