I always try to get as much confirmation as I can, so if I see a divergence and it looks strong enough to cause a change in the market, I not only verify whether other averages and timeframes are seeing a similar divergence, but I check other industry group, important stocks, currencies, volatility instruments, treasuries and more or less anything that has a correlation with the divergence I'm seeing or has an inverse correlation (meaning it should give the exact opposite signal).
As you know I checked Treasuries and was surprised by the size of the divergence and the urgency, but more impressive may have been the volatility instruments. When short term volatility instruments start showing strong divergences and even start moving off those divergences, we are at the move in most cases because these short term volatility assets are meant to replicate a day only so they typically don't move much until it's actually time.
Here are several examples which you have seen in many posts,
but most recently in this one today .
So this isn't too redundant , I'll provide one example from each of the 4 major averages, if you want to see more then simply check out the link above.
The divergences were enough to signal a pullback as of Friday, since then they have added to th negative tone in a big way, I almost feel certain now that a test of the Nov. 16th lows is unavoidable which should be great for short positions taken up for this move and should provide an excellent opportunity to prepare for the next trend by buying low and with little risk before the next move which should be a larger move up.
I'll try to show you later tonight how and why we look at different trends from very short term to very long term, understanding that the market moves back and forth and not in a straight line and having some idea of what order those moves are coming in allows us to prepare and get some of the best prices, it's pretty much like knowing what the market will do before it does it except we can't predict how long or how far without watching the current action.
The IWM 10 min shows a sharp negative leading divergence after coming off a strong positive divergence going in to the lows of 11/16.
The QQQ shows nearly the exact same thing and we know AAPL has similar signals.
The SPY had been a laggard in a couple of ways, one it hasn't yet put in the same larger positive divergence (again this is part of understanding multiple trends in different timeframes) and second its signals weren't as strong, this is a strong, very clear signal in the SPY of distribution. You'll note in each case above, the leading negative divergence which is the strongest is in an area where price is more or less flat or range bound, this is the most common place to see institutional activity.
Now some confirming assets beyond what we have already seen...
Sorry, I couldn't resist AAPL- the 10 min chart here shows the positive divergence at the lows of the 16th, the next day we had a 7.21% move up, we made 115% in a day on conservative calls and this doesn't even count the lows AAPL rallied from the day before, the 2 day move was large. Now the negative divergence is large, it make me think any longs that might have bought AAPL are going to go for a scary ride. In the end though, I think this is more about taking out the shorts before the next really serious primary trend down starts.
Treasuries are the "Flight to Safety" trade, when people are scared of what might happen in the market, they move to treasuries, but smart money also does the same. Long-Only Mutual funds can get killed on a move down, they need a safe harbor during those periods as they can't go short like we can so they move in to treasuries and I think this is why we see such strong confirming signals in treasuries before the move or reversal starts.
Since Treasuries move opposite the market (up when the market is at risk and moving down and down when they want to deploy that capital in higher yielding assets like stocks when the market rallies), the signals we see in TLT should be the opposite of the market averages-we should see positive divergences here to confirm the negative divergences in the averages and stocks like AAPL.
TLT initially jumps this week which was strange as the market hadn't made a similar move down yet, there was some light selling in treasuries on that move the first day or so, then the positive divergence started and it looks like money was flowing out of stocks and in to treasuries.
The 3 min Treasuries/TLT shows the initial positive divergence before popping up Monday, then a strong leading positive divergence in the later half of today to move to a new leading positive high.
The TLT 10 min chart also shows a leading positive divergence before Monday's gap up, again today in the afternoon there was a strong positive divergence.
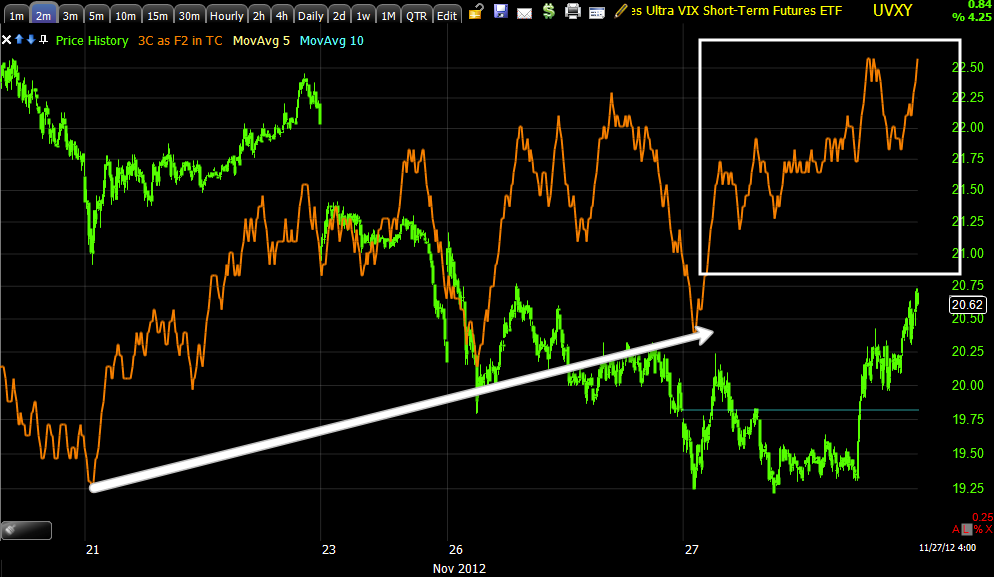
This is UVXY, it is a short term VIX futures leveraged ETF, it is meant to give similar performance to the VIX on an intraday basis, being the VIX trades opposite the market, we'd also expect to see confirmation signals in this asset to be positive.

UVXY 2 min chart positive since last week when we first notices the probability of a pull back this week, today in particular there is a very strong move in a flat range, again it seems money moves in to these ETFs at the last minute right before a move so today's new leading positive high in the afternoon is impressive.
On a 3 min chart look at the size of this leading positive divergence in UVXY!
Even on a 5 min chart, the late afternoon move was so strong it was able to move the 5 min chart as if it were in real time to a new leading positive high.
The 10 min chart is also leading positive and shows the entire area where we first notices something new in the market that suggested a pullback this week on Wednesday of last week and again on Friday.
Even the 15 min chart is leading positive, which is a bit scary as this suggests some rather strong intensity to a pullback move.
The VXX is the same as UVXY above, except not leveraged. This is a totally different ETF, different price and volume so confirmation would be positive signals.
On a 2 min chart, again strong afternoon momentum
Even price responded (this is the Clear Method for Swing Trading-green is the uptrend, red the down and yellow are noise candles). This is a rather impressive move late in the day.

VXX 3 min leading positive at a new high.
5 min the same.
10 min also leading positive
And 15 min leading positive.
Here's the daily chart of the VIX with Bollinger Band buy/sell signals.
In the middle of the chart a daily candle closed above the upper Bollinger Band, then it closed within the band, this is a VIX sell signal and the VIX moved down, in fact it closed outside the lower Bollinger Band and then closed inside the bands creating a VIX long signal, keep in mind the VIX moves opposite the market so a buy signal in the Vix means the market would be expected to fall in the near term.


No comments:
Post a Comment