RIMM however I think has the power, like FB, to move against the market, although in this circumstance I suspect it will pullback with the market.
Any pullback in RIMM I view as an opportunity to add or initiate a new long position.
Here are the charts...
We have been interested in RIMM and have traded it several times, at point "A" we have a stage 1 base, this is where smart money accumulates shares, to technical traders this often looks like a pause in the downtrend or an area that has no action and they largely ignore these areas until price and volume catch their attention. At point "B" we saw the triangle, usually we'd expect a head fake move, but since there was no probable reversal and because the charts looked excellent at the time, I said I thought it would not see a head fake move, it didn't. Point "C" is a nice move up of +36% since the triangle.
A closer look as RIMM moves from a stage 1 base (accumulation) to stage 2 "Mark Up' (this is where the trends and easy money can be found). In white we have two potential reversal candles: a Star and a Doji t, both on increasing volume which is a VERY high probability reversal and it works in all timeframes so that's a concept to put in your tool box (Reversal candles on increasing volume are high probability reversals, there is no measuring implication of the reversal). Using the Clear Method Trending system (slightly adapted, Friday and Monday both contributed to the trend with higher highs and lows, today is a noise candle and that is also a high probability reversal candle and it also is confirmation of yesterday's Doji reversal.
RIMM absolutely should pull back, that=opportunity. The likely target is a gap fill, since HFT's the market has been ruthless about filling gaps.
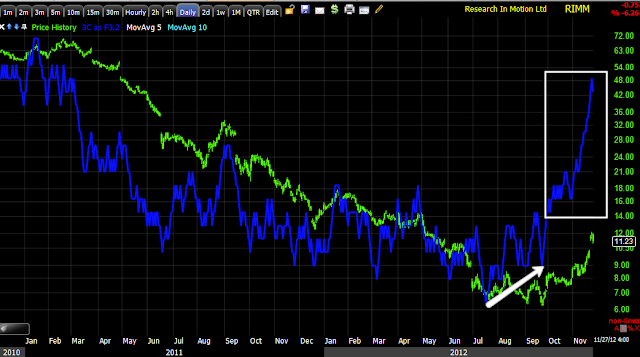
Look at the daily chart, a monster leading positive divergence, this is why RIMM stands out from other stocks.

The 15 min chart is an important timeframe and it is for the most part in line/confirmation, but if you look at the two nearly equal highs in the red box, note there's less money in RIMM at the second as traders are taking short term profits.
This in no way endangers the trend.
From an intraday standpoint, as soon as RIMM popped up it was seeing immediate profit taking, likely because of the size of the gap and traders knowing it would be filled more than likely.
The 3 min chart with accumulation before the pop higher and the same profit taking/distribution at the same area, again not a big deal, but RIMM should pullback.
We want to watch the pullback for a long entry or add to on existing positions. Put RIMM on your radar.


No comments:
Post a Comment