For many of you the term, "The 3 Pillars" is familiar. If not, it's my reference to the 3 Industry Groups that are essential to sustaining any kind of move beyond a short bounce. Although all 10 major Industry groups are important, in my opinion the 3 most important are Tech, Financials and Energy.
Since QE3 was announced we have seen way more sector rotation than we have at any time since March of 2009, before the QE3 announcement, markets were highly correlated and whatever you chose in any of the 3 groups was pretty much certain to rise and fall together, recently we have seen that we need to have a little more diversified positions as sector rotation is taking place, even if only for a day or two.
During the mid-October bounce we had positions in leveraged longs including Financials and Tech, one day Financials were in and the next day Tech was in and Financials were out, this is VERY different from the "Buy any asset" as the market formerly was two positions, "Risk on" or "Risk off", now we are seeing rotation and as such, it's important that Tech starts to look good for any shakeout move arising from last week's range-bound market.
Tech hasn't been an impressive leader lately, but Friday I mentioned a change in character in Tech toward the more bullish side, today I want to show you some of the developments, but first relative Sector Performance.
Both are 1 min chart, the first is has a bit more history and the second more recent. For instance, today it's clear that Tech is showing better relative performance than Friday while Financials are showing weaker relative performance since Friday. The recent trend since the price range we were looking for matured, has shown Utilities and Staples over this timeframe both having declined and are moving out of rotation which is important because these are defensive sectors that typically do well when the rest of the market does poorly and vice-versa.
A closer look reveals Tech coming in to rotation while Financials are out today. Industrials, the momentum filled Basic Materials group and interestingly Energy are all showing better relative performance than Friday while the flight to safety sectors fall out except Health care which is relatively stable.
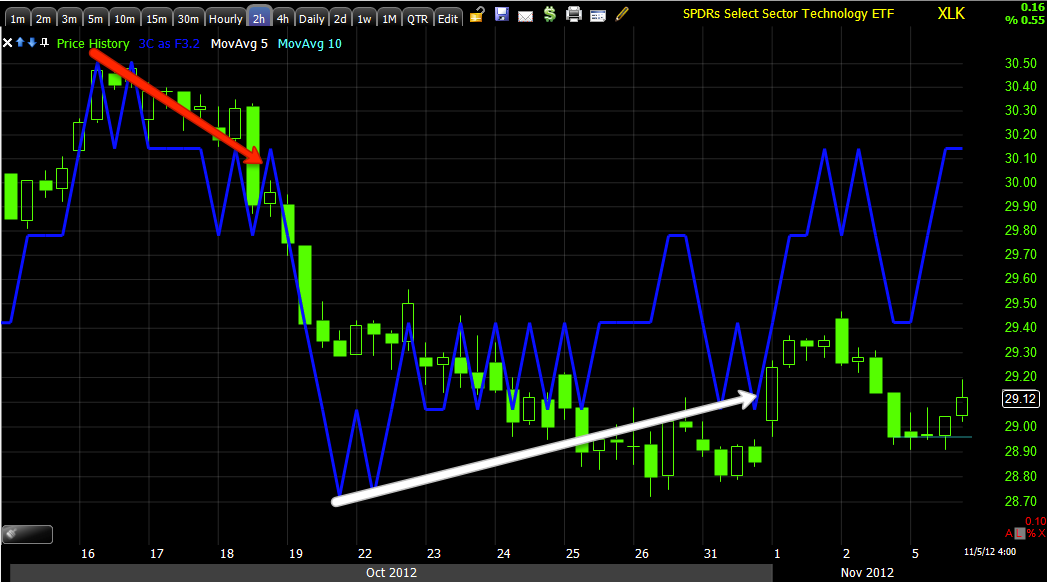
As for Tech charts...
This is more impressive and a larger signal than I believe we will see play out, a 2 hour chart with a positive divergence through the range and a leading positive divergence at today's levels after Friday's decline. This is an impressive chart that is almost purely trend with very little noise.
The 30 min chart, also an impressive timeframe, shows the same thing with a little more detail, the main point being, the post-Friday divergence has been leading positive in an uncertain environment. Take away the macro events and just looking at the charts, I'd say there's pretty strong confidence that Wall Street has positioned for a move higher in the very near term.
A little closer to today's events, the same time period on a 5 min chart shows Friday's head fake gap-up opening and a leading positive divergence today as we once again saw a day that was largely lateral trade.
All in all the Tech sector is looking good and like someone has put together a decent size cycle for an upside move/short shakeout.
I want to use this move not only on the upside with our recent entries in to leveraged longs, but eventually as the market tells us, to get ready to close the longs and enter more substantial or add to existing short positions as the longer term probabilities are highly skewed toward a decline after 1 last shakeout of new shorts.
As for Financials...
The 15 min chart is all we really need for a nice shakeout move higher, here we have that. We can see a leading positive divergence form last week and Friday's head fake gap higher in to a negative divergence or selling sending the sector (along with the market) lower, for whatever reason and there have been plenty offered; I believe this has more to do with the tactical execution of Wall Street's cycle than anything else, simply put, this was either part of the plan or the plan deviated and they made a correction. In any case, today's action shows a 15 min leading positive divergence in to the pullback from Friday's open; the sector still looks like it has plenty of gas in the tank to bounce/rally.
The more detailed 10 min chart shows the mid-October bounce that went negative, the range from the 23rd to the 31st with a positive and leading positive divergence and of course Friday's action and a positive 3C position currently.
Finally the more detailed 5 min chart shows Friday's gap up with a negative divergence as soon as the market opened, this gap was being sold immediately, but not aggressively (at least not in the underlying trade). Today we see the 5 min chart move to a new leading positive high, even though price is lower than Friday. All in all, Tech and Financials are still in basically the same good shape they were in as they emerged from the range.
Finally Energy which has been hit hard since QE3 was announced. I talked a LOT about the conventional wisdom of the market concerning QE3 back when it was announced and hoe emotionally I felt like I should close all shorts and go full long, but I said I wouldn't make a decision based on emotion or the conventional wisdom because things are very different now than QE1 or 2. Instead we waited for the information/proof to come in and we were 100% right for doing that, Energy is one of the greatest examples of why we were right not to take the knee-jerk, conventional wisdom, but rather look for evidence as Energy fell badly after QE3 was announced in direct contravention of the "conventional wisdom".

Energy/XLE on a daily chart shows a clear and very strong negative divergence RIGHT AT THE QE3 ANNOUNCEMENT! We saw this back then, we wondered if the charts would change and gathered evidence, but the long term charts were correct. For this reason, unless the market delivers a different message in the coming weeks, I want to use any price strength to sell long positions in Energy such as ERX and then move to short positions and/or add to existing core shorts like IOC which is still at a +15% profit and XOM (so long as they are still high probability/low risk trades).
The 4 hour Energy chart also shows the area where QE3 was announced and the negative divergence in to the announcement followed by Energy's decline of over 7% since then, had I made a knee jerk reaction toward conventional wisdom, IOC would have been covered at the worst possible time only to find itself profitable in the days ahead.
We can also see a positive divergence recently between the white box now and the white trendline area earlier in the month, Energy looks like it is FINALLY coming together for a move higher, one I think will be used to shakeout shorts so Smart Money can essentially take over those positions at better prices with less risk.

The 2 hour chart shows a negative divergence right at the QE3 top, confirmation for much of the move down and a recent positive divergence that includes our expected "range" area.
On the 15 min chart we have a positive divergence that sends energy more lateral with a head fake breakout move that is sold just like the market last Friday. As is usually the case with failed moves (head fakes), they reverse quickly in the other direction and Energy takes out support, this hit a lot of stops and allows Wall St. to make money on increased volume rebates, allows them to pick up shares for a bounce at better prices with as much supply as they need to enter these larger position without arousing suspicions. Note 3C is in leading positive position as that support level was broken, implying the stops that were hit were accumulated for a run higher.

Finally on the 1 min chart we see the recent small head fake below range support and just like the larger break below support above, this one too shows a leading positive divergence once again suggesting this head fake move was accumulated as stops were triggered. These head fake moves usually are the last event we see before a reversal so we may indeed be very close.
The main point is I'm glad we didn't make an emotional decision Friday to exit longs, the evidence since late Friday has supported our view that we will see a strong upside move that will eventually fail leading to the next truly serious leg lower in the market.


No comments:
Post a Comment