I don't know if Smart Money has an idea of what is going to happen, we know that some of the best traders in the world are Congressional Staffers so that would imply that while the TV tells us everything is in the air, these guys have an idea on what is really going to happen and I'd expect some of that to filter to Wall Street.
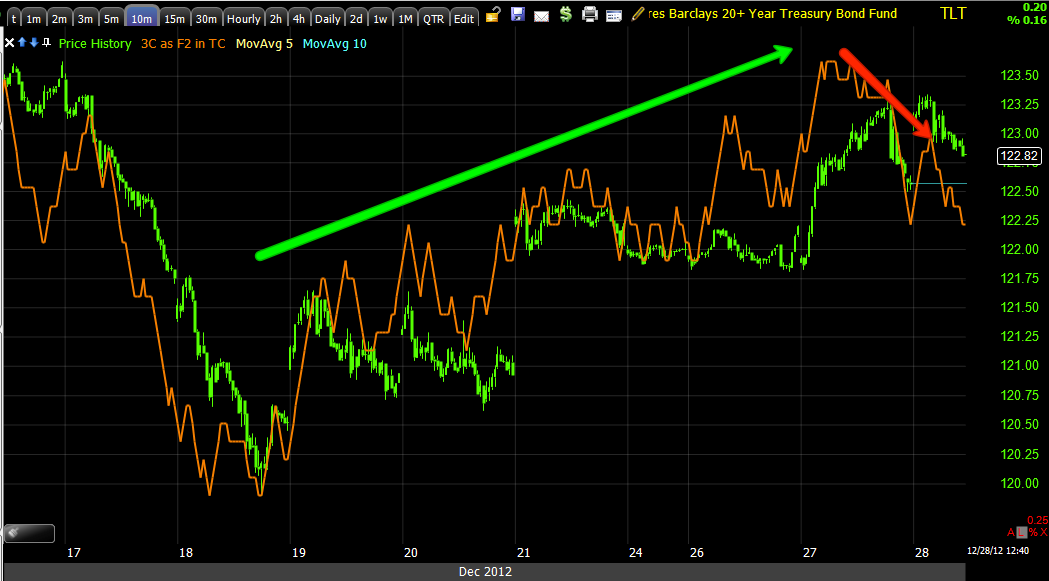
Here are Treasuries/TLT which are considered the "Flight to Safety Trade", so these should move more or less opposite the market, when traders are afraid they take money out of stocks and put it in Treasuries, when they are feeling confident about the market moving up they take money out of treasuries and put it to work in stocks. So the price action in treasuries should be roughly the opposite of the market, but more importantly for our purposes, the underlying 3C signals should help us (at least act as another piece of evidence or piece of the puzzle) to determine the outlook.

Currently the 1 min chart is exactly in line with price and this is the frustration I'm dealing with in most assets in this timeframe at this moment.

We see a negative divergence yesterday afternoon which panned out and a leading negative divergence right now which is even worse.

Now at the 10 min chart, this is where we have some transition and I believe separation between the two trends, this isn't that negative so I wouldn't expect this to reflect any of the market upside, it's more of a transition point for the second trend, the downside move which is expected to be longer and larger.
I showed you virtually the same thing yesterday in Financials using FAZ.


No comments:
Post a Comment