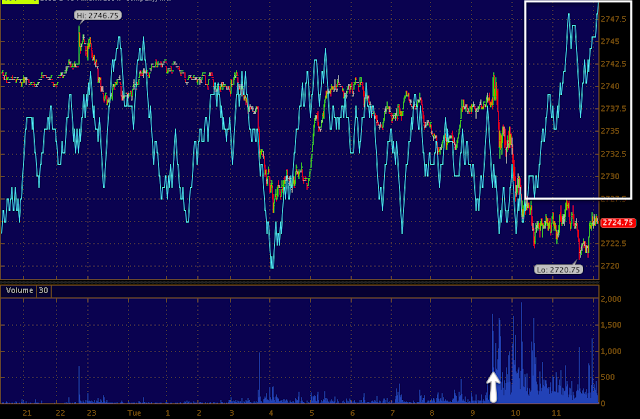
Without posting multiple timeframes of 4 different averages, I find these two simple intraday (1 min) futures charts of ES (S&P futures) and NQ (NASDAQ futures) illustrate the point I made in the last post very clearly.
Above is the Es chart, I'd call this flat, there's really no signal here, it's very dull and pretty much in line.
However the NASDAQ futures since the open look very different on the same timeframe, this is a good proxy for the market averages I was just talking about.
Is interest rates about to start going up?
-
Yes, I know - it does not make any sense - FED is about to cut
rates...but....real world interest rates are not always what FED wants it
to be.
6 years ago


No comments:
Post a Comment