The QQQ Cals with an expiration of TOMORROW are currently down - 2.63% which is a lot less volatile than I had thought they might be.
As for the Futures and specifically the 1 min vs 5 min charts (you may recall I grew concerned the other day over the 5 min chart not acting as it had over the last week and a half or so), there's some new or old developments.
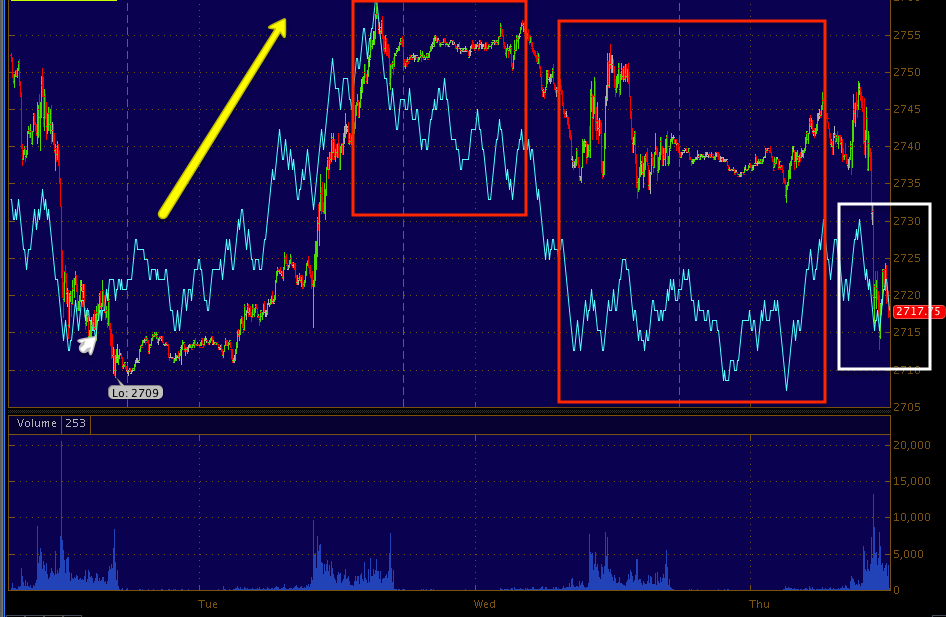
Here are the S&P 1 min E-mini futures with a leading positive divergence intraday.
Here's the ES 5 min chart that was working great before the yellow arrow where we saw confirmation which concerned me as it was a change, but now we are getting back to the former behavior.
The NQ / NASDAQ E-mini futures ar also showing a relative and a leading positive divergence here, thus the QQQ Call position earlier.
Here's the NQ 5 min chart with that same area of concern in yellow and more recent behavior acting like the older behavior which was very helpful. Note the current, small positive divergence.
This is the EUR/USD, to the far left at "22" on the time scale, that is 10 p.m. E.D.T. (last night), "3" is 3 a.m. when the European market opens, can anyone explain the sudden ramp of EUR/USD on the European open?
You'll have to decide what you think the large leading negative divergence through a flat trading range (one of the most common price formations where divergences are noted) means. Just coincidence? Noise? Sentiment? A Leak? Pre-arranged market manipulation?
I don't think a signal with a trend that clean is coincidence.
I see the NYSE TICK is improving....


No comments:
Post a Comment