I want to post this to give you some short term (as in what's going on now) and longer term perspective, each of us is unique, we have different risk tolerances, we have different priorities as to whether it's more important to be fully in a position and ready or whether it' more important to get the best price with the lowest risk and the best trade, but be willing to risk not being fully loaded or set or more likely the happy medium between the two.
I'll use the SPY for an example and a few other charts and try to make this as simple as possible.
I have to start out with the caveat obviously that momentum can change very fast, especially as we get in to a more volatile market, look at the Euro pre-market vs the Euro now, it went from 100 mph to 3 mph. Also the further we are along in this process of topping/reversing, the less predictable or less reliable the probabilities as market participants take a "Whoever sells first, sells best" attitude; this is EXACTLY what happened with AAPL, all of the concepts and signals said we had 1 more good move to the upside and that's where we wanted to be short AAPL, but every hedge fund out there wanted out of AAPL all at the same time so the usual behaviors and probabilities became much less reliable as we have large funds fighting for their very existence and multi million dollar jobs (or a lot more). Keep all of this in mind, it's not a "Weatherman's, Partly Cloudy" caveat, "well it could rain because there are clouds, but it might not because it's partly cloudy", this is just the truth as AAPL revealed painfully.

SPY 1 min momentum is fading here, a 1 min chart's negative divergence can lead to a correction/consolidation laterally through time.
The 2 min is still in line, if it were negative too, it would be more likely that we correct to the downside or even move lower.
This 3 min chart still has a decent head of steam, so until or unless the 1 min negative migrates and turns these negative, I have to assume the chances of continued upside are still good within a reasonable timeframe of a day or so.
At 5 mins, this is where we kind of hit the median or neutral point and start moving toward the more negative charts, the bigger picture, the highest probability trend looking forward, etc.
I looked at leading indicators and they don't look all that strong on the positive side at all, in fact CONTEXT shows how poorly other risk assets are performing today, like credit...
ES in red is trading significantly rich to the model at -12 differential, that's substantial as the model (green) is more in line with where ES should be trading. Looking at leading indicators, I have no argument with this chart.
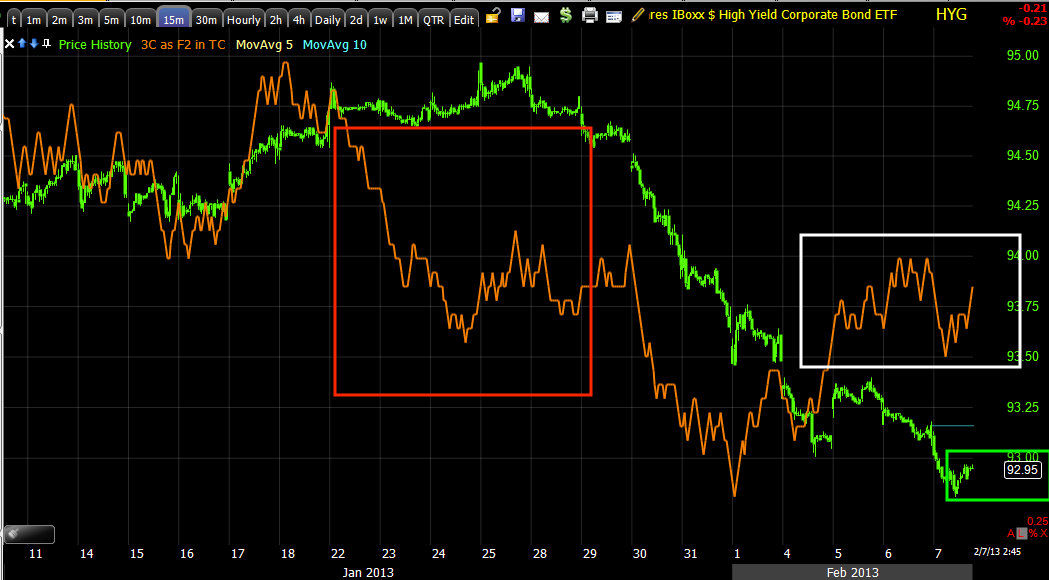
Here's a sticking point, High Yield Corporate Credit loos about the same as the SPY on the timeframes above, but this 15 min chart is pretty darn reliable and it's saying HYG wants to move higher, this almost certainly moves the market higher, short term though I'm thinking HYG travels laterally in the green box which means down from these levels a little bit.
Ultimately the divergence/dislocation between credit and the SPX is far too great to overcome and it's pretty much a done deal for the market, it is now a question of when and where, not if.
The SPY 30 min or 60 min which I didn't put up, are really ugly, another reason it's not really a question of if, just like it wasn't with AAPL. I'm thinking with the SPY, ultimately we have something like what you see in yellow as potential upside or areas where it would be best to short as long as we have some of these signals and the HYG positive 15 min chart.
If we look at the big picture, this is probably what we are talking about...
The potential upside or best area to short with the least risk is still in yellow, the probability of trend #2 over time, not in one straight move is below the November lows, it's possible its even below the June lows. So you have to weigh that when making the decision as to what the positioning is worth, I tried to get the best positioning with AAPL and was trying to get ...
Trying to get short at the yellow box in that area and it looked likely as a complex top that should make 1 more shoulder and shake out more traders, but it never did and missed the red arrow move.
The closer we get, the more the herd starts to break apart instead of flocking together, that's why (as I mentioned with AAPL) and what they motivations are and why the outcomes that are normally VERY high probability see an increase in risk as well as volatility.
Just keeping it real...


No comments:
Post a Comment