Here are the points of interest for me in the SPY with the weekly puts, but also as part of the big picture.
I try not to draw on the charts unless I have to point out something because I think it distracts from the divergence which I think most of you are fairly adept at seeing at this point.
I do note the positive 1 min Friday vs the negative yesterday because on Friday I was going back and forth over whether or not I should open a SPY Call position, I decided that I didn't like the atmosphere, the 3-day weekend and although remote, the possibility the G20 might say or do something that upset the apple cart, which is pretty upset today with AAPL down 1.54% already, this is why yesterday was specifically a day trade in AAPL ONLY.
In any case, the divergence was right, but as I said, I'd rather miss the bus and catch the next one than be a pig led to the slaughter.
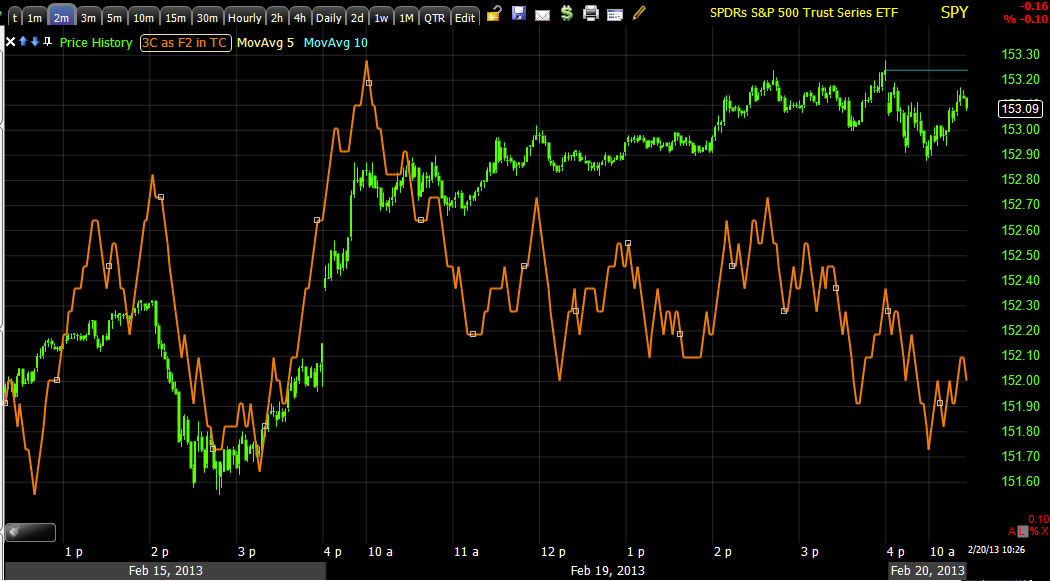
The SPY 2 min chart looks like I want through yesterday's and today's trade thus far.
As does the 3 min chart.
What was really interesting to me yesterday and today is the 15 min chart, it too supported the idea of calls Friday, however yesterday's negative divergence is not only longer in duration, but much deeper and is a leading negative vs. a relative positive.
Of course it has been the 5 min futures charts that have been the key signal in picking these weekly options trades, remember I'm not a huge options fan, but with the 2 feet forward, 1 foot back, 1 foot forward 2 foot back type of trade the last 3 weeks, quick and leveraged has been the tactic that has been working best. I would much rather be in a straight equity trending trade, but you take what the market gives and as I showed you last night, over the last 3 weeks and even this year in some instances, being long and sticking with it has delivered in some cases half a percent, that's not worth the market risk, not when you can make 35-100% (some members are scratching out 300%) in a trade that lasts 1 to 2 days.

What is really interesting about this last SPT Put from yesterday is the 15 min chart in a really ugly position here.
With all the hoopla yesterday, the TICK Index not hitting +1250/1500 is strange, it hits that pretty regularly even in a +.50% day, I think this all comes back to the breadth charts of "Percentage stocks above 40 day moving average" or some standard deviation above and how they have fell dramatically since Feb 1.
In any case, today's TICK looks like it just took a step down.


No comments:
Post a Comment