Here's a look at the SPY divergence that is a very weak one, but could get the job done and a look at some other averages and how things look there as well as the IWM Put and why I'm inclined to leave it as is.
This is the same 2 min relative positive divergence I showed you earlier, it's still active.
This is a 5 min relative positive divergence, but these were created out of weakness, these aren't the kind I'd be going long.
SPY 10 min is the end of anything remotely positive and is leading negative instead.
DIA at even 3 mins is leading negative
The 10 min chart is leading negative
QQQ 15 min deeply leading negative and look how quickly, at the same time breadth was even worse in to market price strength.
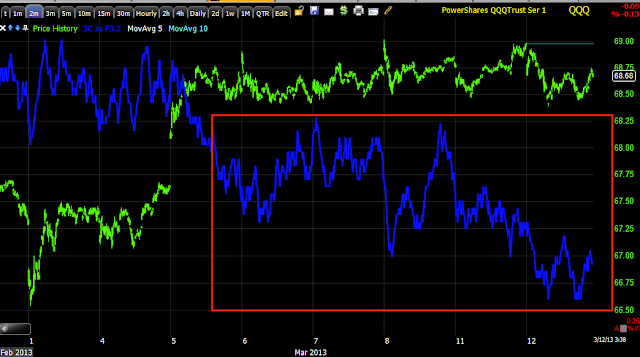
QQQ 2 min leading negative-sorry this should have been before the longer chart.
QQQ 60 min, this says something, especially as it comes right after the area I consider to be the area where the trend's back was broken.
IWM 30 min has been in line, these are the charts I love, they move with price and then diverge sharply, these are among the most reliable.
IWM 15 min-remember the QQQ 15 min in the same area with the same sharp neg. divergence
IWM 10 min
IWM 60 min, again remember the QQQ 60 min and where this divergence falls.


No comments:
Post a Comment