I have a feeling we are seeing a little more of the true market here when manipulation of the VIX and other methods (like Bloomberg AAPL rumors) aren't working as well, it holds with market breadth, longer term 3C charts, market volume, etc.
There are some better looking short term charts, but not a whole lot better.
The move since the 5th has a distinct feel in most of the averages, one of distribution as seen here in the DIA,
Here's the 5 min chart as the DIA hit new highs, distribution
The 3 min chart confirms the 5 min perfectly.
On the intraday 1 min it is perfectly in line, no real positive divergences at all here.
The IWM 10 min over the same period since about the 5th, showing distribution
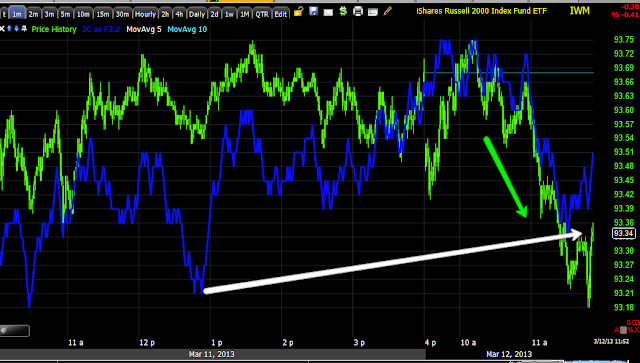
The intraday 1 min chart is on line with price too, but there is a passive relative positive divergence in place.
QQQ 2 min over the period of the last 5 days or so, a mini range is seeing some distribution here
The 1 min chart is showing an active positive divergence intraday, we'll see what it can do, perhaps we are seeing some rotation, perhaps it's just temporary.
SPY 5 min over the same period since the 5th which has been an odd-almost parabolic move with no pullbacks, similar to a short squeeze, but it has the same distribution signal
Intraday the 2 min chart is negative at today's highs
The 1 min chart is in line, no positives at all, 3C is confirming the price moves to the downside intraday.
Today is the first day in several that the TICK has seen any downside extremes at -1100 so far.
More coming, there are a lot of assets to look at.
Is interest rates about to start going up?
-
Yes, I know - it does not make any sense - FED is about to cut
rates...but....real world interest rates are not always what FED wants it
to be.
6 years ago


No comments:
Post a Comment