This is what I was hoping to see, the NASDAQ futures move back up to at least the green arrow while the 3C chart makes a new low which so far has happened. My best guess from here would be a range for a little while with some volatility running stops on either side of the range.
The 5 min NASDAQ Futures is not moving down like I wanted to see, but it's not making any upside gains either, I'd rather not get stuck taking a put position in a slow lateral drift.
The QQQ 1 min is really about the intraday, but I also wanted to give you some sense of where it is within the trend, especially on a move like this in price where confirmation becomes important and the first and easiest confirmation if it is there is found on the 1 min chart, which it is not here.
Recently the 2 min chart has picked up downside steam, remember that divergences migrate from short timeframes to longer ones if they are strong enough.
The 3 min chart showing the same kind of downside momentum as the Q's get stuck in some lateral movement or the start or a possible range.
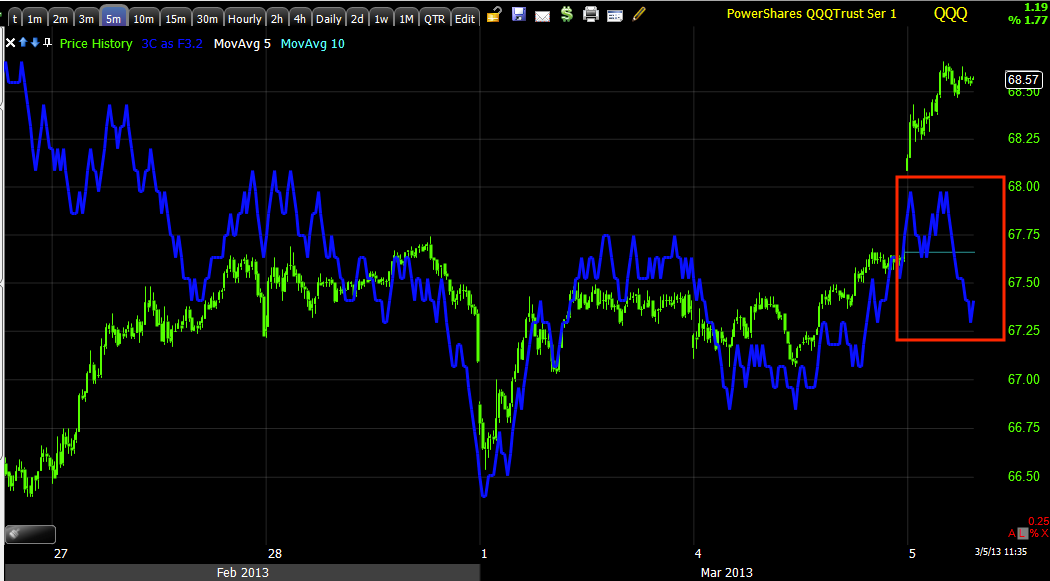
The 5 min is just seeing some intraday momentum as well, I also wanted to give you some idea of where it was in the recent trend.


 | Theme by Thur
No comments:
Post a Comment