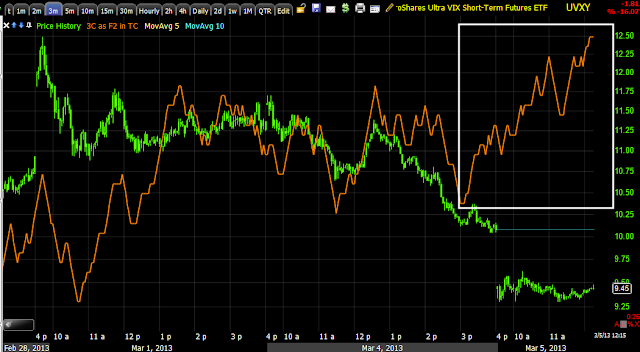
The 3 min charts have been the standouts in volatility lately, as I said, this makes the 3rd move, I was looking at something else when a member, luckily pointed it out.
Here's what today's move looks like.
VXX Short Term VIX Futures and a 3 min leading positive divergence
UVXY a leveraged version of the VXX above with a very similar 3 min leading positive divergence.
XIV which is the daily inverse short term VXX, the exact opposite of VXX with a leading negative 3 min divergence.
Here's the interesting part, all 3 of these ETN/ETFs are moving according to the VIX futures, whether at a 1:1 or leveraged move or even an opposite move, but they are managed to reflect the price changes in the VIX futures, that's all done by the ETF managers, however 3C works by showing demand which is something the ETF managers can't create.
Whether the VXX traded 100 shares all day or 100 million, the percentage move would be in line with the underlying VIX futures percentage move no matter how much or how little demand there is.
This is why I find it interesting that for the 3rd time, all 3 of these ETN/ETFs have had the exact same signal, when the price percentage move is not what 3C tracks, but the money flow or demand which is irrelevant to percentage gains in these assets like most ETFs. When there's a 3 min leading positive in the two longs and a 3 min leading negative in the inverse, that is because there's a coordinated move coming from smart money, selling the inverse and buying the long volatility.


No comments:
Post a Comment