
The other was High Yield Credit giving up the entire year's gains in 2 days...

Some other basic leading indicators didn't look too hot today either...


The last couple of weeks we've noticed unusual activity in TLT, the 20+ year Treasury ETF or the flight to safety trade, today was no exception 3C spiked toward the end of the day.

The recently hot IWM lost the momentum game today...

We saw several new large sell signals today in the DeMark inspired custom indicator...

Every measure of breadth I have been posting (Percentage of stocks above or below their 40/200 day moving averages) deteriorated today, every one of about 12. Interestingly I ran across a proxy index of the most shorted Russell 3000 names, which have outperformed by a large margin over the last month or so, however they fell the last two days as well, which should be showing up in the form of even worse breadth readings as the short squeeze in these names that propelled them higher is seemingly at an end.
I've been thinking a lot about the Q1 period of 2012 when it was incredibly clear to anyone who read beyond the headlines of economic reports that they were coming in with headline beats, but the data inside showed how weak they were, it was all due to seasonal adjustment which we covered last year almost daily and many times could find no benchmark for the seasonal adjustment, they were pretty much headline beats and then whatever adjustment had to be used to get them there, around March we started coming out of that period and CITI's Surprise Economic Index went from up to nearly straight down as the seasonal adjustments ended, it was an incredible insight in to just how manipulated Q1 data was, although as I said, if you read the reports and not just headlines, you already knew that, this caused us to build up large core short positions and by May 1, every short was in the green, by June every single short was at a double digit gain. So I had been messing around with some graphics software trying to overlay 2012 over 2013, I'm not as computer literate as you might think, I made a mess, but I found this chart today from Bloomberg that did it for me...

Kind of interesting huh? Unfortunately the Citigroup Surprise economic index is no longer available on Bloomberg without a paid professional subscription. However going down memory lane, here's one I published from last year around the same time...

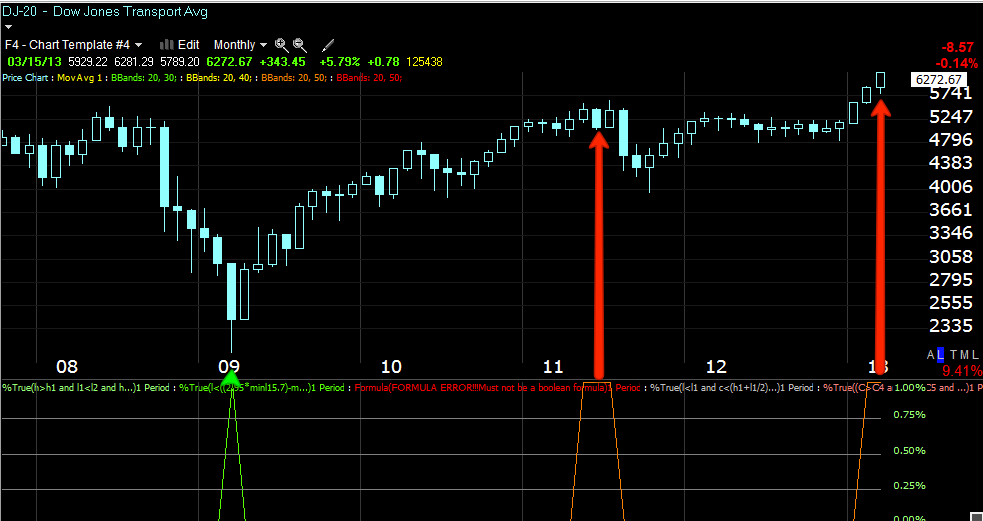
However, by far (and this can't be taken alone, you have to consider breadth, volume, desperate measures with the VIX and the fact it does have a point in which it can't go any lower, leading indicators, money moving out of the market, safe haven trades seeing money move in, treasury Yields moving to lows, the Italian election, re-newed problems in Greece with the Troika, the recent 2-day data decline and perhaps the real dark horse, China and their inflationary stance against the world), this chart takes the cake for perhaps one of the most important developments perhaps of the year, 1 simple chart...

I'll be covering currencies later this weekend and I'm thinking to cover Bellwether stocks, the momo plays and their 3C charts. Before I was using 3C, I had a good feel for the market simply by looking at a lot of charts, when there were more short or long candidates by far, you knew which way the market was heading, taking a look at underlying trade just gives us a head start.
Have a great weekend.


No comments:
Post a Comment