Since the Bernie press conference on September 13th, I believe at 2:27 p.m. to be exact, when Bernie was asked about inflation and he answered with something never said before, QE could be adjusted and people REALLY started paying attention to the added phrase,
"Within the context of price stability". I mentioned it that day, the market did not like what it heard and even though QE3 was announced, the market went up for a few hours the next day and that was in until November 16th. Everything after that out of the F_E_D was what I called "Slow boiling the frog", first with a new yard stick for QE, no longer calendar based, but economic based which was a huge change and introduced "Uncertainty" as no one can predict what the economic data will be 4 months ahead, a calendar date though is very certain. Then came more and more in the minutes and subtle changes in the policy statements, speakers started
for the first time, started talking about the end game and the effectiveness of further asset purchases vs. the risks associated with withdrawing policy. As Ex-F_E_D governor Kevin Warsh said, "Policy accommodation is easy to get in to, it's withdrawing it that is very difficult" and the F_E_D was slow boiling the frog, hinting that they were thinking about the end game.
Today John Williams, President of the San Fran F_E_D said the F_E_D
could begin tapering QE3 as early as this summer. This was just upping that ante and the market reacted as it almost always does to anything F_E_D or F_O_M_C related, it knee-jerked.
Don't get me wrong, the market will front-run the F_E_D and sell off long before policy accommodation is halted, but I'd say that nothing moves straight up or down for too long without correcting. The other thing is smart money is a lot smarter and a lot further ahead of the ball than most realize. How did they know to accumulate home builders in 2000 a couple of years before the next bull market was led by housing and consumer spending which came from home equity lines of credit due to the housing bubble. How did they know after the Tech revolution that something as dull as housing was going to lead the next bull? I think that's a question better left to the F_E_D to explain.
So this isn't a surprise...
Remember on September 13th as QE3 was announced we already had a negative divergence in the market and I said,
"My emotions want to go with conventional thinking and close all shorts and buy long, but the charts are saying something else". The market did nothing for more than a month after QE3 and then it fell for the next month,not at all the reaction conventional thought expected.
The distribution since then has been solid .
The hints have been there for a long time and the rot I talk about in the structure of the market can be seen in a lot of places.
Take for instance transports, they actually helped the market higher, but have recently diverged.
Dow-30 vs Transports.
However, they don't call it Dr. Copper for nothing, this is demand for a commodity that tells us a lot about demand throughout the economy.
For a while copper ran with the Dow, look at where it diverged, the yellow arrow is exactly the place where I said, "When we look back a year from now, this is the place where the back of the market's trend was broken.
There were a lot of things leading up to this, volatility was one of the big ones that told us something big was changing, but this is where something REALLY changed.
This is when the Trend Channel was broken, I warned back then that the market usually heads higher after this happens, but it's usually very volatile and we often see a break that can take out a month or more of gains in a single day, thus it's very dangerous to stay in the market once this signal of the Trend Channel stopping out occurs.
A lot of breadth was really destroyed today and any rally or bounce from here is a dead man walking, but I certainly wouldn't rule it out.
As the SPX is just off new highs, consider these breadth indicators and how badly they were taken apart today even though the percentage decline wasn't anywhere near as bad as breadth would suggest.
The SPX is red, the indicator is green.
Percentage of stocks trading below their simple 40-day moving average, the damage was already done long before today, in fact, right where I said the market's back had been broken, that's where the decline went from over 80% to under 50%. Today 10 percentage points were lost from yesterday (55.86% yesterday to 45.94% today),
less than half the stocks in the market are above their 40 day moving average as the SPX is just off all-time new highs. In January when the SPX was 7% lower, the percentage of stocks was over 80!
Percentage stocks trading 1 S.D. above the 40-day m.a. went from 35% yesterday to 25% today and from 70+% in January.
Percentage stocks trading 2 S.D.s above their 40 day m.a.,
it's clear where the back of the market was broken, the same place as the trend channel as the percentage went from over 40% to 4% when the Trend Channel was broken. Now as we are just off all time new highs, we are at 7.34%, just off the low of 4.8%!!!

Percentage Stocks Trading 2 Standard Deviations above their 200-day moving average,
from over 40% to 30.55% yesterday to 22.43% today!
Percentage of stocks trading 2 S.D.s BELOW their 40 day moving average,
this doubled today from 7.31% yesterday to 15.04% today.
However, as I said last night in the Daily Wrap...
"As for Dominant Price / Volume relationships today among the component stocks of the major averages, it's mixed again today, when they are all in the same direction I'd say we are close to a downside break."
The same is true for 1-day oversold, when all of the averages are showing a Dominant Price/Volume relationship (not the average itself, but each of the component stocks that makes up the average), today was such a day, the most common reaction is a close higher the next day. Here are some of the major averages all showing the same DOMINANT (this is important) Price/Volume Relationship.
All NYSE stocks (Note the relationship that is dominant over the others)
Dow 30
NASDAQ 100
Russell-2000
Russell 3000
S&P-500
Every one of the major averages was CLEARLY dominant today, ALL THE SAME- Price Down/Volume Up, this is a 1-day oversold or short term capitulation event most often. Sometimes it's the relationship you see on the first big break lower, but I suspect today it's the more common 1-day oversold and most often the next day closes higher.
We saw some indications of that today, here are a few.
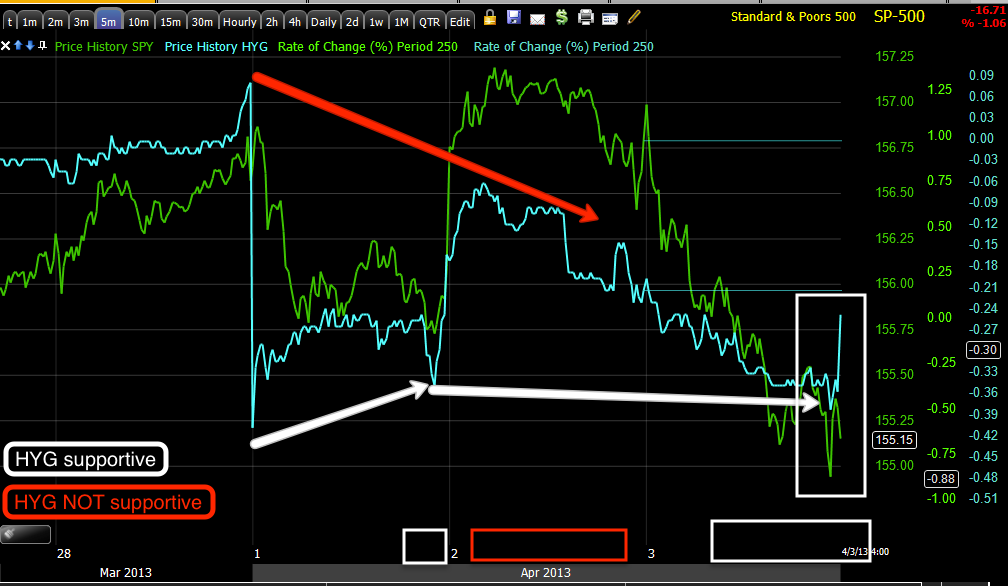
The CONTEXT SPY Arbitrage model was green most of the day, meaning the model was higher than the SPY as the levers (HYG, TLT and VXX) were used today to help out the market.
For a day like today seeing High Yield Credit closing higher and up in to the EOD is a strange sight.
Yields are definitely negative, this is the flight to safety I have been talking about for well over a month, it takes large institutional money time to establish positions and at favorable prices. In any case, Yields hit their lowest yields for the year, but this is nothing new, Swiss 2 year rates and German 2 year bunds are negative yields, meaning people are willing to pay to lend money to the Swiss and Germans just so they have a safe haven to put their money and these aren't retail investors.
HYG is one of the SPY arbitrage assets, it's High Yield Credit, in white we see areas where the SPY arb would be green as HYG is used to help move the SPX up, in red areas where it was not being used as a lever and the SPX didn't respond well, today's close was an interesting move in HY Corp. Credit.
Remember the VIX from last night, the small triangle, the Bollinger Band Squeeze, the opinion that VIX would likely see a downside head fake before it explodes to the upside, we'll see if we get that this week, but it's what I'd expect unless the market is just so broke that the sellers bum rush the doors like they did with AAPL, but seeing High Yield Credit among other things today, I don't think that's the highest probability.
VXX-VIX short term futures sure weren't very bid today compared to where the SPX closed. It looks like VXX and the VIX futures lever was used today.
UVXY traded the same way.
The Euro is more supportive than the SPX seems to show right now, in other words, the Euro is there to support a move higher at least for now.

The Yen carry I have been saying is most likely being closed and that's why the Japanese can't jawbone the Yen lower any longer, the first area of Yen break from the downtrend was the same area the Trend Channel was broken and recently the Yen has been telling us something about Hedge Fund financing of stock purchases, if you are wondering what that might be, just look at the move higher in the Yen (something that happens when a carry trade is closed) and look at breadth indications above, the story is fairly easy to see.
The SPX moving lower and Yen higher looks very much like the Carry is being closed and stocks sold to do that, that doesn't mean the short term moves won't see upside, it looks like they will, but there's damage done that can't be undone very easily, it's the ROT I have been talking about just under the surface of the new SPX highs.
I'll update futures next and we'll see if there's a hint as to tomorrow's action, however, as for the April monthly puts, I think they'll be just fine.


No comments:
Post a Comment