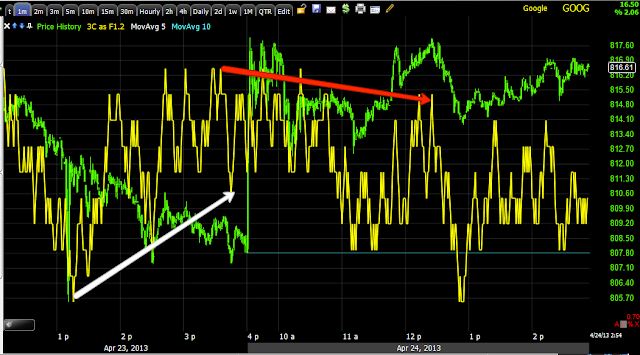
Yesterday the GOOG long (Call) trade was taken (May 10 $800) as a short term trade.
The P/L for this trade of less than a day is nearly 23%.
If you look at the charts from yesterday in the post linked above, that's the reason I liked this trade. If you look at the same charts below today, they look very different. While there may be more upside, a 23% 1-day profit is nothing to complain about.
I often decide on whether to take the trade off or not by looking at the position as is right now and asking, "Would you enter this trade today?" If the answer is, "No", then I don't have a lot of reason to hold it either, especially with the leverage of options which can turn against you fast.
GOOG 1 min-compare to yesterday
GOOG 3 min
GOOG 5 min-again compare today's signals to yesterday's, you'll see the difference between a high probability trade and a trade with very little edge.
The timeframes of 1, 3 and 5 minutes should also make very clear this was intended to be a short term trade taking advantage of a strong, high probability short term signal.
Is interest rates about to start going up?
-
Yes, I know - it does not make any sense - FED is about to cut
rates...but....real world interest rates are not always what FED wants it
to be.
6 years ago


No comments:
Post a Comment