I was hoping to treat the PM post as 1 post with all of the assets, but it's too much to get in to one post and pay attention to the market at the same time so I'm going to break it up and start with my least favorite asset to analyze, Silver, which is one of the most manipulated assets in the world.
In Roman times the silver price was fixed at a specific ratio to gold prices, that was 12:1 or 12.5:1. In the late 18th century the ratio was fixed by US law at 15:1; around the same time France fixed it at 15.5:1.
My how things change... During the 20th century the average was 47:1. In 2012 with Silver trading at $31.15 and gold at $1669 per troy oz. the ratio was 53.6:1.
Because silver is a smaller, less liquid market than gold (gold is about 18 times larger) it's easier to manipulate, the 1970's Hunt Brothers is a good example when they cornered the market and drove silver up to nearly $50 and oz., Warren Buffet did something similar in 1997. You may remember the viral internet campaign by Max Kieser to break the JPM silver short that they inherited when they absorbed Bear Stearns, Blythe Masters was the specific target as she was responsible for protecting JPM's short, more recently Morgan Stanley is said to have a large silver short as of 2012. HSBC was also caught up in a number of lawsuits for price manipulation of Silver. There's also the ETF and other scandals based around the assertion and most likely fact that the paper silver market such as SLV has more claims on silver than there is actual silver in storage, the point being it's an easy market to manipulate. Thus it's one of my least favorites, but with 3C we should be able to follow the money flow so that's what we look at.
Here are the charts, please remember I'm not making any assertions other than there's some initial evidence that a change may be under way and if so the chances are very high it is early in the process.
I like to start with weekly charts, this 5 day shows a clear range which is often where we see accumulation or distribution (due to the steady prices which are more than likely due to market makers/specialists trying to fill a large order to buy or sell at a specific price so they work the market to keep prices in a range until they've filled the order.
The break below support of the range in the last week (the last 5-day candle) would normally be taken as the start of a new down trend by technical analysis, but we often see these "head fake" moves just before a reversal in the opposite direction of what T.A. expects.
On a daily chart, here's the range and the break below it.
Here's the range using a line chart, what I want to show here is that a reversal is almost always a process, not an event so we tend to see "U" or "W" shaped bottoms rather than "V" shaped, so to the left I have drawn a little graphic of what I would consider to be the fastest bottoming process, a "U" shape and to the right you can see just about how far we "might" be in that process". The reason most often is because it takes time to accumulate a position in the size institutional traders hold, thus the process rather than an event.
The daily MoneyStream shows what may be a small positive divergence as MS has not made the new low below the range and it otherwise has been in line with SLV over the last year.
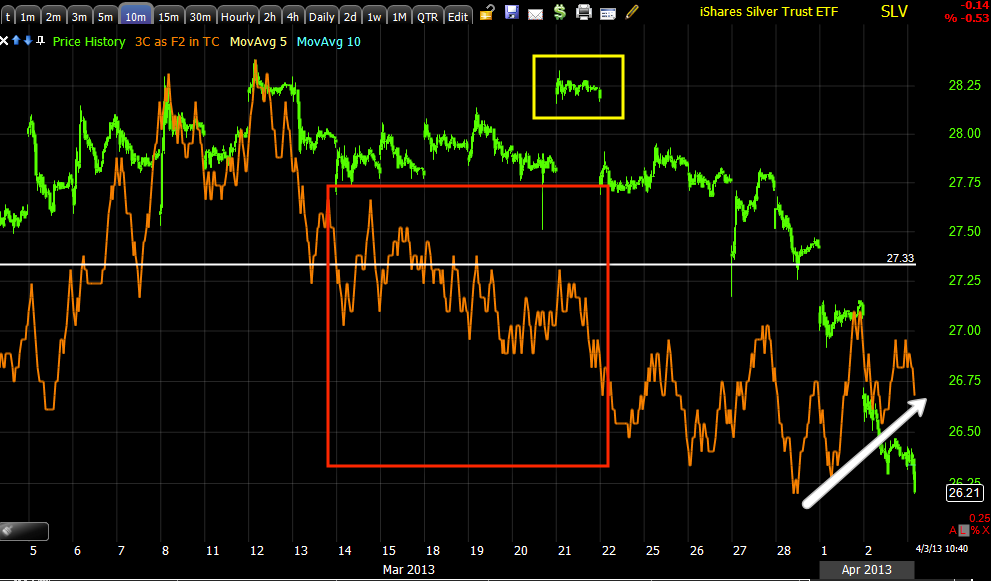
The 15 min chart of SLV shows 3C has also been in line with the downtrend in SLV, it's more the faster charts where new divergences start that grabbed my attention.
The 2 min chart is right in line with distribution in the range, there's even the head fake move I mentioned in yellow making traders thing SLV was breaking out of the range, this brings in longs and price reverses which creates a bull trap and adds downside momentum as new longs sell at a loss adding supply to the market. However on the break below the range the 2 min chart is showing an initial positive divergence.
Here's a closer look at the 2 min chart's positive divergence. This alone would not warrant any further analysis, but there's more.
In the same range with the same head fake move (I wish I had seen that as 3C was very clear there was distribution in to that break out, which would have made a beautiful short), however once below the range there's another positive divergence migrating through longer timeframes.
Here's the range's support, the head fake also confirmed distribution there on a 5 min chart and a recent pair of positive divergences below the range.
A 10 min chart confirms distribution at the head fake move-this would have been a great short, below the range another positive divergence, so there's decent migration giving credibility to the divergence.
The 15 min chart shows a weaker relative positive divergence.
After 15 min the charts are all in line with the downtrend, 30, 60 min , etc.
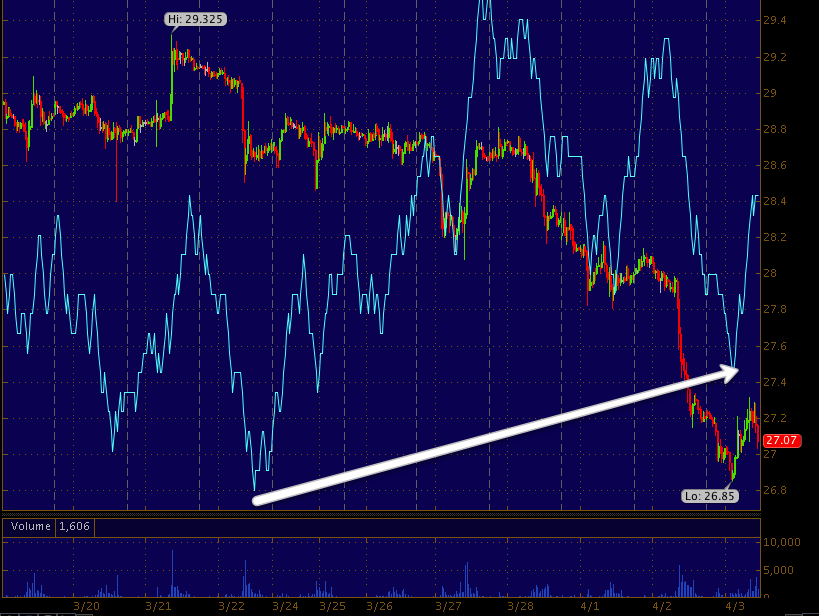
As for Silver futures...
The 5 min chart recently went positive
As has the 15 min chart
And the 30 min chart with a relative divergence.
At 60 min, 4 hour, day, etc it is still in line with the downtrend.
So at this point I'd personally not get involved, but keep SLV on my radar, some might wish to get involved early on here with a tight stop, I personally just am gun-shy with PM's and require a lot of proof, but something seems to be going on.


No comments:
Post a Comment