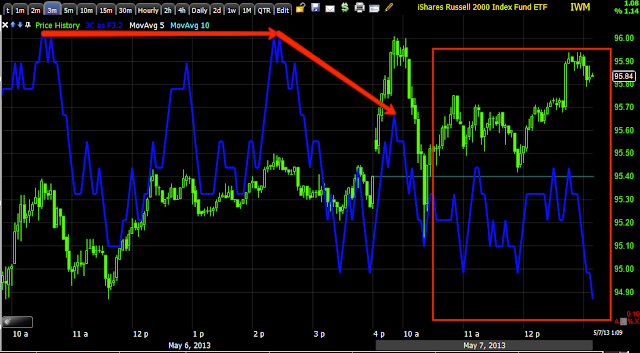
This is exactly why I don't let the emotion of greed, "I better move fast or I'll miss the move" make decisions, I let objective information make decisions. Had I chased the IWM this morning on the downside move, I'd be in a worse position than right now where the opportunity is looking better as I suspected it would as it was too early in the day.
The IWM shows the longer term migration of negative divergences through the charts that make the Put move a high probability looking move, tactically intraday it's all about leading indicators and the very short term intraday 3C IWM charts.
1 min saw no positive divergence, but popped back up, mostly drafting the other averages.
The 2 min chart saw a small positive divergence at this morning's lows, since then though it has simply been in line, not leading positive, I want to see these go negative for intraday tactical set ups/timing.
The longer chart shows the trend more clearly, as I often say, if you're in doubt, go to the longer charts. The 3 min shows the clear near term distribution trend.
As does the 5 min chart
And the 10 min chart, now it's up to short term 1 and 2 min charts as well as other confirming indicators to give us a tactical signal. Ideally it is an upside momentum run in to a fast downside negative divergence, that would be the best set up for puts.
I'm checking the Leading Indicators.
Is interest rates about to start going up?
-
Yes, I know - it does not make any sense - FED is about to cut
rates...but....real world interest rates are not always what FED wants it
to be.
6 years ago


No comments:
Post a Comment