I mentioned USO/oil as a short candidate last night, there are a couple more charts I'd really like to see fall in line before it really looks great, but with the typical a.m. trade period and the 10:30 EIA Petroleum Status/Report coming out this morning, I figured I'd use this time to show you a few things.
Daily USO, I'm just pointing out Reversal Candlesticks with higher volume and their tendency to be more reliable reversals,
a candlestick reversal does not imply a target, it could be a 1-day reversal or something much bigger, the only way I find they imply any target or sense of importance is the timeframe chart they are found on like 1 day vs a weekly chart.
The recent run has seen the real bodies of each candle diminish in size which is a sign of a loss of momentum / health.
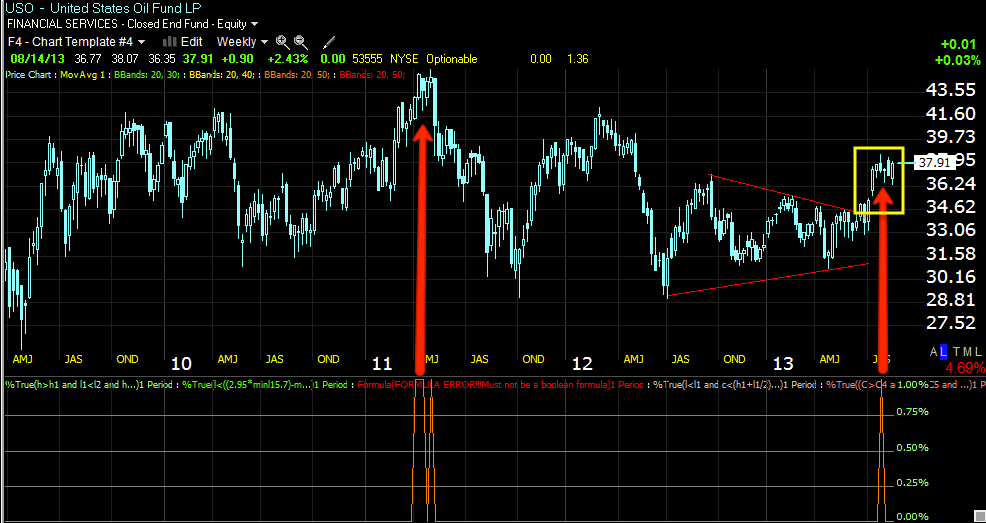
The weekly chart shows a very clear and dramatic drop off in volume through 2013, really this has been going on since 2011.
The yellow resistance zone does look like a tempting stop / limit run on a head fake move so that's one thing that's held me back a bit.
Some weekly sell signals with the last one coming out of a symmetrical triangle that really had no bullish/bearish bias as the preceding trend was a large lateral choppy range.
The 60 min chart shows the start of the cycle with accumulation to the left and a mark up period in green and now a leading negative divergence.
The 15 min chart with a small accumulation area and recent distribution- however there are a few timeframes in between these that need to be filled in before I'd feel very comfortable with a new position.
Intraday 2 min USO
3 min USO
This is Crude (Brent) 5 min chart.
I think USO is worth paying attention for a position soon.


No comments:
Post a Comment