Both of these are short term equity vehicles to trade VIX Futures, UVXY just has 2x leverage.
Like the bounce in the averages has longer term positive charts that are the basis of a bounce, being the VIX trades opposite the market, it too has longer term divergences that are negative in support of the prospect of a market bounce and I don't mean a day or two of 1.2% gains, I mean something more serious, a swing or more.
There's a reason I only picked a few assets today, I went with the ones that looked the best and let the others wait a bit until they look tighter.
VXX 1 min has been hanging around price in what I've been calling, "Blah" 3C/ price action. Today was the first day that VXX / UVXY both went leading negative and deep as well as fast.
Something obviously changed in these two today as market averages were starting to show accumulation at the same time, which is a form of confirmation being they move opposite each other.
The 3 min chart is not a slam dunk, it is negative though
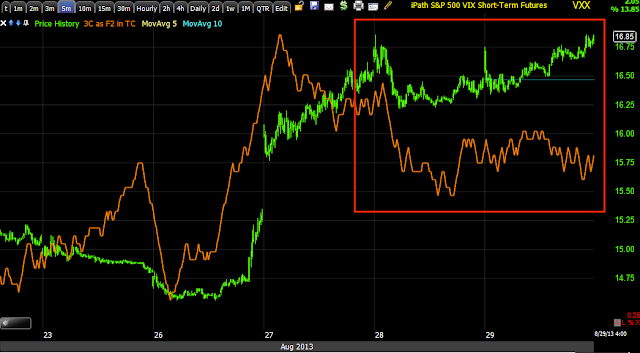
The 5 min chart is much more negative
The 10 min chart is more than enough to confirm a market bounce with VXX heading to the recent lows easily.
The 30 min chart though is really damaged for now. This is why fast moving intraday divergences like the 1 min seen today can change the price action quickly, the damage is already done, it's like a car teetering off a cliff, it just needs a little push and that's what those intraday charts are to VXX now.
Is interest rates about to start going up?
-
Yes, I know - it does not make any sense - FED is about to cut
rates...but....real world interest rates are not always what FED wants it
to be.
6 years ago


No comments:
Post a Comment