However, while I do not have the intraday charts yet to back up this theory, I do suspect this latest shakeout (the complete retrace of ALL FOMC gains) is part of the larger SPX Futures positive divergences as it also had a beautiful rounding/reversal process as of last night, the move below that area would be out HEAD FAKE, taking out more longs and dragging shorts in to the mIx.
ALL OF THIS WAS COVERED IN GREAT DETAIL IN A VIDEO LAST THURSDAY NIGHT THAT PREDICTED ALL OF THIS ON THE BASIS OF SIMPLE MARKET BEHAVIOR. ALSO WHY WALL STREET FORCES THESE EVENTS AND HOW PRICE IS CVERY DECEPTIVE AS ONE BEARISH LOOKING EVENT IS ACTUALLY PART OF A LARGER BULLISH EVENT WHICH IN TURN OS PART OF AN EVEN LARGER BEARISH SETUP- MULTIPLE TIMEFRAME ANALYSIS.
Although it seems the different trends are working against each other, as I tried to show in Thursday's video, they are in fact all working together toward the same outcome and how you trade it all depends on the timeframe you are looking at, but how you understand the trade for that timeframe is contingent on understanding the entire picture with all timeframes/trends included.
If you missed it or would like to review the concepts in the video, this is the link to last Thursday's "Daily Wrap", which has an embedded video player and a link to YouTube at the bottom of the post.
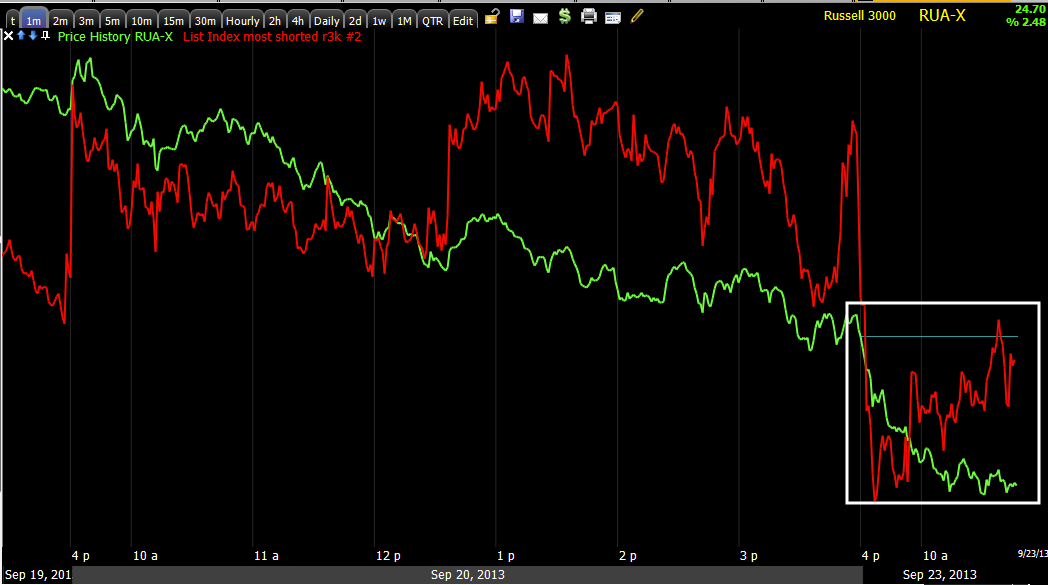
The SPY so far...

This is a chart of volume in the pattern using a custom cumulative volume indicator I threw together quickly that I use to confirm H&S tops as the price pattern attracts every technical trader who sees it which is not hard, but volume is the most important way to reveal a true H&S vs. a random or manipulative price pattern. Early in the market rally around Q1-Q2 of 2010, a H&S price pattern showed up, traders were sucked in, but as we pointed out then, VOLUME DID NOT CONFIRM and in this case, volume is just as important as the price pattern itself, it turned out to be a false pattern and shorts were burned.
The rules of volume for a H&S: An H&S top has essentially 3 parts with 6 trends that make it up unless it's a complex H&S top with multiple shoulders which are still usually symmetrical (meaning if there are 2 left shoulders, there will be two right shoulders, if there are two heads and a left shoulder, there will be 1 right shoulder to match the 1 left shoulder).
On the rally to form the first move up or the left side of the left shoulder, volume often looks as it should for a rally with higher volume, but sometimes it is lower, it's not as important. The decline from the top of the left shoulder should see increasing volume on the downside. Then the ascent/rally to form the left side of the head should see volume dramatically fall off as it rises and as it falls to create the right side of the head, volume should increase dramatically. Finally the right shoulder should see a clear failure in volume on the rise to create the left side of the right shoulder and volume should increase on the decline from the top of the right shoulder back to the neckline.
Other than the fact price doesn't bear resemblance to a H&S as the right side of the head never fell far enough to the neck line, it does look a lot like a commonly seen (technically bullish) early breakout in a Broadening Top, this I believe is part of the Primary Trend head fake.
***The one feature that can give you early guidance whether a top is real and whether it will convert from a broadening top (as I said above, ALL H&S tops start as Broadening Tops first) to the more common or recognizable H&S is volume itself. While volume in a H&S top has VERY SPECIFIC requirements (see above) and as such can be seen as a probable H&S BEFORE the left shoulder forms which ultimately confirms a H&S rather than a Broadening top, A BROADENING TOP'S VOLUME IS ERRATIC WITH NO EXPECTATIONS AT ALL, IT CAN LITERALLY BE ANYTHING, IT IS ALWAYS ERRATIC.
This is the current SPX formation on a daily chart.


Then another break as the ENTIRE F_O_M_C Rally is taken back THIS IS THE F_E_D KNEE JERK REACTION I ALWAYS TALK ABOUT, THE ENTIRE INITIAL 1-DAY KNEE JERK MOVE WAS FADED.
Volume increased as support at the start of the rally broke and now we have a nice head fake set up (check volume on the break). Now most longs will have stopped out and many gone short, this is what is needed for our expected short term move as I explained in the video, 1 event that looks bearish is simply a fuse to light the next trend that will appear to be bullish which lights a larger fuse to another event that is the primary goal which is bearish. This is not a random process, this is what Wall St. NEEDS to do to create the supply and demand they need to move in and out of huge positions that would move the market against them otherwise.


The linear regression lines of the SPY and TICK are also consistent with an upside reversal confirming the downside move was indeed a head fake, this gives us a great timing tool for the upside move.
I'll let you know as soon as we start to see 3C confirmation, but it is not unusual for these head fake moves, ESPECIALLY ONE THAT RETRACES THE ENTIRE INITIAL FOMC KNEE JERK MOVE, to be more dramatic than smaller trends or shorter timeframes, there are several layers of stops in the order stack and Wall St. will go down as far as they can as long as the cost/benefit analysis of getting to the next stack of stops lower still makes sense, if the next cluster is significantly lower, but few in number, it no longer makes sense to bring the head fake down any further. ADDITIONALLY, the deeper the head fake, the more effective its upside reversal becomes as a short squeeze alone creates a stronger move not to mention several other factors which can all be found IN MY TWO ARTICLES "UNDERSTANDING THE HEAD FAKE MOVE" (linked at the top right of the members site.


No comments:
Post a Comment