Nearly all of these we saw strange behavior in Friday, very strange with the exception of TLT (20+ year treasury).
VXX and VIX futures look to be in the reversal process which is characterized by the rounding bottom, but also 80% of the time we see a head fake move, this one a stop run and it occurred off the open in VXX. HYG still doesn't look good from Friday and TLT (I was hoping it would come down) now looks like it may, those are the 3 arbitrage assets and with VXX and Up and HYG down, that'a negative pressure on the market, TLT down however is not. However TLT's normal correlation hasn't been dominant recently, in fact it's almost been shadowing the SPX, just a little bit late, like a shadow.
It's still very early in a.m. trade to take anything too seriously, but I am wondering if VIX futures are getting ready to make a turn up, I still have open VXX calls.
The VIX 15 min Futures positive 3C divergence and rounding bottom, at the yellow trendline would be where this morning's head fake move would have taken place, it did hit orders, but it's not as large as they often are, however if it hit enough orders and there aren't many stacked below, it's not relevant.
A 5 min chart of VIX Futures just to see the trendline and this morning''s possible head fake move.
This is VXX (short term VIX futures) and you can see the 3C positive intraday divegrence as well as volume on what looks like a stop run on the open.
Here's a closer look at the same, the yellow arrow is this morning's open, note the volume.
HYG really turned ugly Friday, this intraday 1 min chart shows it continuing today.
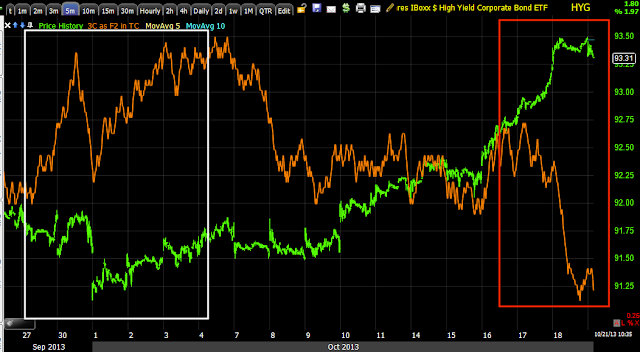
More importantly the HYG 5 min chart went from accumulation around late September in to early October at the lows and has seen recent distribution, this has been used as an asset to support and push the market up as algos read it as institutional risk on and buy.
These are the accumulation/distribution signals in TLT (20+ year treasury) and it's not looking good recently with a leading negative divegrence.
The actual 30 year Treasury futures (5 min) also don't look so good with a recent leading negative 3C divegrence and a relative negative at last week's highs.
There are some 1 min intraday charts that look like TLT could bounce a bit from this area intraday, but that's about it for now.
The TLT 1 min intraday, not a strong signal because of the short timeframe, but good for intraday movement, so this is the bounce or perhaps consolidation intraday on the TLT chart, remembering that a.m. trade is not the best time for good data, especially on a Monday, but everything here looks reasonable thus far.
The NYSE TICK has been negative most of the morning so far, my custom TICK indicator shows the short term SPX trend coming unglued from TICK data (see the Histogram).
SPY intraday 1 min is in line as trade has been all night since the open yesterday in futures, but...
You don't have to go far to see damage, this is the 2 min chart leading negative
And of course the 5 min chart.
For now, I'll wait to see if TLT will bounce the market as the SPY intraday is still in line, still holding VXX calls and will continue to.
Is interest rates about to start going up?
-
Yes, I know - it does not make any sense - FED is about to cut
rates...but....real world interest rates are not always what FED wants it
to be.
6 years ago


No comments:
Post a Comment