I've been using a lot of leverage lately, or lets say the last several months and there was a reason for that, a lot of the trades that were showing up looked like great signals, but the signals also told us the trade duration looked to be very short before we got tangled up in chop, this is the reason I preferred the leverage of options and also the reason some of our best option positions were in and out, rarely longer than 1 day (opened 1-day, closed the next) and that was great for capturing the signal, the initial momentum, we had a double digit gain for what was often only 4 hours of market exposure. However the reason I'm leaning toward leveraged ETFs (mostly 3x) is because they are less leverage, the draw down is easier to manage because things can get choppy and messy near a reversal point and options don't tend to tolerate that kind of action very well and honestly, I prefer not using leverage unless it is needed.
I'm also looking at some of these charts and thinking there's a decent probability of a swing and that's easier to capture with leveraged ETFs rather than options, at least for me.
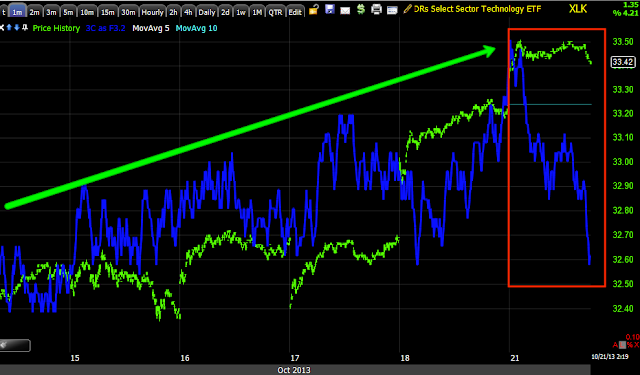
Here's Tech (XLK) and TECS, this was one of the groups that was falling apart quickly on Friday.
When looking at the charts, notice accumulation in to the October 9th bottom, where we had our VIX sell signal and look at the distribution/negative divergences specifically since Friday (10/18), it's very interesting as it looks like the start and end of a complete cycle.
When I say "Wall Street rarely does anything without a reason", the reason we were looking for was a number of shorts that were so close to a head fake move that they just needed that extra push, I believe and have believed since a week before it started, that's what this rally was going to be about.
You can see XLK made a breakout, not only a breakout high, but a Channel Buster as well.
You know how channel busters often end and this was also part of last night's analysis as to the question of a reversal process, Channel busters being much tighter, in my exact words I believe, "From a failed move comes a fast reversal".
XLK on the "Trend " version on the 3C indicator on a daily chart. Notice anything odd about 2013?
I find the 15 min chart interesting because it's effective again with market swings, check out the accumulation areas, especially October 9th which comes up EVERYWHERE and pay attention to Oct. 18th.
This intraday XLK chart was one of the fast moving negative leading divergences last Friday on several different charts, look what it added today.
The 2 min clearly shows the accumulation in to Oct. 9th and the dramatic change in character Friday.
Speaking of dramatic, the 3 min at the lows at the 9th and 3C is punching down to a new leading negative low, which started in earnest Friday.
This is TECS on a 3-day 3C chart, it's kind of interesting. The last 3-day candle looks like a head fake move doesn't it.
Again the short term intraday saw a dramatic change Friday.
Here it is again.
TECL is the opposite of TECS, it is TECH 3x leveraged and should give the opposite signal, look at that5 min chart's new leading negative low and almost all of it coming from Friday.
Is interest rates about to start going up?
-
Yes, I know - it does not make any sense - FED is about to cut
rates...but....real world interest rates are not always what FED wants it
to be.
6 years ago


No comments:
Post a Comment