It seems the trouble in China continues with the SHCOMP down about -1.5% overnight and the Nikkei down by almost 3%. This time it's not just inflation in China and their monetary policy which I understand from a member is now being reported in the main stream economic media, but the Japanese QE-Zilla from April 4th is not doing its job and apparently making things worse. Also in Europe as banks (especially Italian) were routed yesterday and had to be halted for trading, their having another non-epic day on a few economic bits.
ES overnight gained about 2 points from the 1747.75 4 p.m. print to the 1749.75 9:30 a.m. print which is to say ES was flat overnight, but this tends to be what we get even on these weekly option expiration Fridays.
Japan...
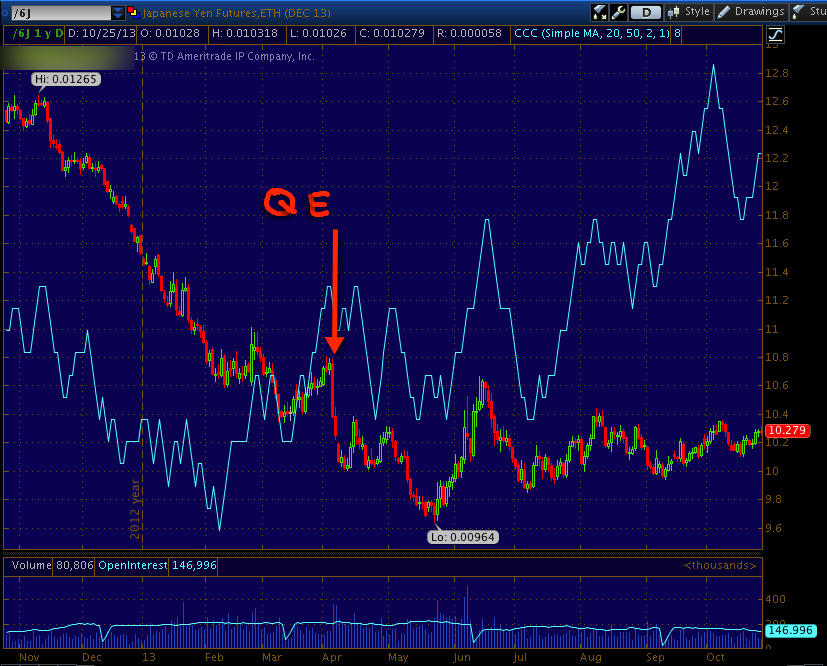
On April 4th of this year the Bank of Japan with a new head (Kuroda and co.) nominated by new PM, Shinzo Abe set out to fulfill Abe's campaign promise to halt nearly 2 decades of deflation in Japan. As a result the BOJ released QE-Zilla on April 4th of this year, a gigantic $1.4 Trillion in injections, ultimately seeking to DOUBLE the Japanese monetary base in 2 years, the initial signs of their QE backfiring were almost immediate as JGB's went limit down numerous times over a series of a few weeks. That's when I wrote these two articles that I still believe are accurate and the end of the market run with a plunge that I believe could lead to the US's first true secular bear market in equities will have deep roots in a currency crisis centered on the Yen and the charts I'll show in a moment show that thus far instead of QE-Zilla doing what it was suppose to, it looks like my theory of the Yen heralding the "End of days" so to speak, is still on the table.
The articles are linked on the member's site, they are from April and you can find them here... Currency Crisis part 1 and Currency Crisis part 2
Since The April 4th QE-Zillla was unleashed, the Yen weakened as hoped sending the driver of the Nikkei 225, the USD/JPY cross higher...
...


And the accumulation expected in such a base...


Why? CPI data was released overnight for Japan, besides Food and Energy inflation (remember Japan has been caught in a deflationary spiral including wages for nearly 2 decades), normal, "healthy inflation came in at 0% for September, a modest improvement over August at -0.1%, but not what 1.4 trillion in QE should have bought according to the BOJ.
While food and energy price climb (up 7.4% y.o.y.), wages are still falling for 1.5 years straight, there is no business investment and (surprise, surprise, I wonder why?) exports to China are ... "Sluggish".
It seems this massive monetary experiment, much like the US's, is not performing as advertised, in fact not performing at all.
China...
In China overnight the SHCOMP was down -1.5% as SHIBOR rates shot up again.
Europe...
Not great news there either, the famous German IFO Business Survey saw it's first miss and drop in 6 months. However the bigger problem uncovered in data released overnight is the continent is seeing No Credit Creation, EU banks are not lending, M# (Money Supply) overall growth declined in September. So while European loan creation is virtually nil, the only thing happening with loans os the number of non-performing loans is rising.

US
As you know futures were largely flat overnight... I hate to borrow charts, but if they help members understand what's unfolding than I'll let my ego and pride take a backseat.

The biggest problem for Bernie though in his use of the Stock Market as an "Effective? " policy tool through the "Wealth Effect" that obviously only benefits those with enough disposable income to invest in the "risky" market, the super rich is now maybe losing whatever teeth it may have had (I'm assuming Bernie is a believer in trickle down economics if he believes the Wealth Effect is effective)...


No comments:
Post a Comment