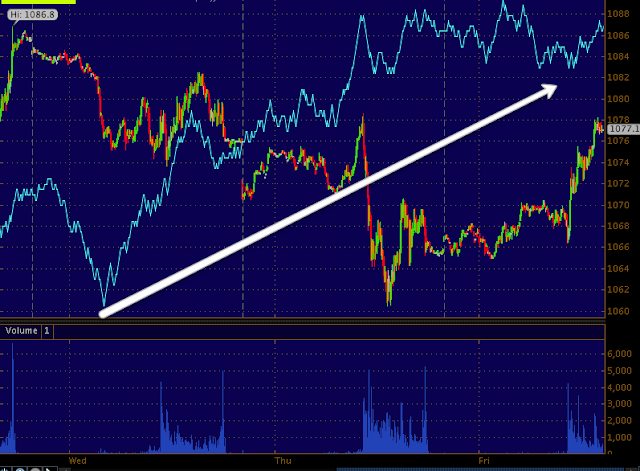
This is my custom TICK Indicator, it's like MACD, but instead of using two moving averages, it uses the linear regression of the SPX vs. the linear regression of the TICK. The TICK should stay strong on a move up, here you can see more and more stocks are refusing to move higher so the intraday breadth is coming apart.
This is the R2K Futures 5 min chart which is positive, I showed it several times this week and last night.
This is a big part of why I think we get another leg up and that fits with the expectations as well as I have expected the ascending triangle in the IWM to see a breakout, that's where I think we see a lot of very heavy distribution, not to say we don't already have that. What I'm saying is the ascending (bullish) triangle isn't there by coincidence, this in my view is part of a set up cycle to accomplish a goal, to get retail bullish and provide Wall St. with demand to short in to, a breakout above such an obvious ascending triangle would go a long way towards that goal. By the way, this has been our view since we saw the triangle forming.
IWM 2 min intraday losing 3C.

the 3 min chart is as well, I drew is a rough pullback, I'm not predicting targets here, just giving an idea of what I think is most likely to occur.
On the 5 min IWM chart I'm trying to show how much accumulation I believe there was for this cycle and how much distribution we are seeing roughly which leaves room for another leg up as the real distribution target is a break out above the triangle where retail will chase it.
In a moment though I hope to show you how insignificant this is to the big picture. I've said this before and I still believe it, "We are not 'near' the big picture, we are well within it".
This 10 min IWM chart shows the ascending triangle and the current action, again I drew in a pullback which I think is starting now and another leg up which is the breakout above the triangle.
Again, this is important for near term trade, it's tactically important for longer term strategic planning, but the price move itself is insignificant in the larger view of the market.
At 15 mins, there's a clear distinction between the last 10 min chart and the leading negative of this 15 min chart. In other words, the market is already exceptionally fragile right now. Again I drew in what has been my expectation, this is nothing new.
Looking at a 2 hour chart of the IWM, the very strong leading negative divegrence and what could be a H&S top, but I think more likely will be a broadening top. If you follow the red line I drew, that slight jiggle to the upside is what the breakout above the ascending triangle would represent to the larger picture, again it's insignificant as far as price, but it's very significant as far as strategic planning and tactical execution of core short positions.


No comments:
Post a Comment