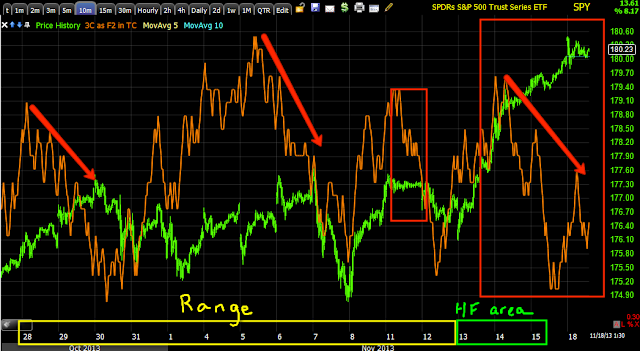
Here's a quick look at the averages, pretty much for the most part they are loitering around the Psychological whole numbers, however there's damage as there was and shown in Friday's EOD posts.
SPY 1 min just loitering around a triangle, it's not even clear what will happen with the triangle, I'm certainly leaning toward a break under the triangle and maybe a closing candle like a bearish engulfing, but there may be a Crazy Ivan shakeout first or a head fake move first.
Intraday charts are really bland, especially considering these highs. Volume too has been VERY bland.
Looking at the SPY from the range and the previous 3-days above the range this leading negative 10 min doesn't bode well for the market.
The Q's 1 min intraday is loitering with no 3C or price direction.
However...
at 2 min it is pretty clear what's going on with the QQQ, THIS IS WHY I SAID THE QQQ WAS MY SECOND CHOICE WHEN OPENING THE IWM PUT ON FRIDAY.
The 15 min chart is pretty clear as well and makes perfect sense with the HYG signals from the last post.
IWM 1 min again, listless
At the 2 min chart, HUGE difference. You can see where there was accumulation for the "Channel Buster" breakout and you can even tell that a Channel Buster like this is unlikely to hold just on the small accumulation zone.
The 5 min IWM and Channel Buster, that Channel Buster is EXACTLY where the previous 3-days that broke above the market range are.
Is interest rates about to start going up?
-
Yes, I know - it does not make any sense - FED is about to cut
rates...but....real world interest rates are not always what FED wants it
to be.
6 years ago


No comments:
Post a Comment