I'm going to look at lot closer to today's action, but I have a feeling I may be looking for something that just doesn't exist, something other than pure vanilla, plain old market weakness.
I mentioned ES as it seems that way just from price action, remember VWAP is a tool used by institutions to judge how good of a fill a market maker or specialist got them.
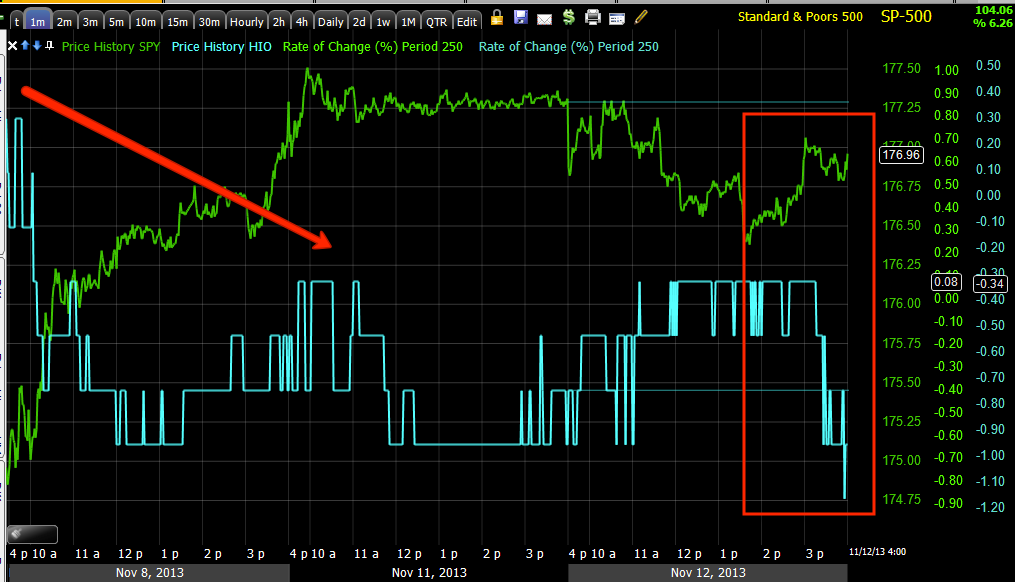
ES/VWAP, in this configuration, the bottom channel to VWAP in the middle, this would normally be selling, it looks like every time price fell away from VWAP, some attempt was made to get it back up there where an order could be executed. Whether it's VWAP or not, there's some thing VWAP-related going on.
As I said about the averages, short term intraday and others...
This was the SPY w/ a positive intraday yesterday, it didn't go anywhere and today's didn't get far, in fact the positive around 2:45 was apparently to lift ES off the lower VWAP channel-look above.
Longer chart, but not much like 3 min, pretty clear, note the mini cycle, what we saw, why we called it that and what has happened since.
SPY 5 min is clear, the mini cycle is there, it looks like it was there for a reason, but other than distribution at higher prices, I don't know what else it could be at this point.
QQQ intraday is just a mess, no real trend at all.
That means you go to longer charts like the 5 min, the mini cycle is clear and so is the leading negative after it.
QQQ 15 min around the mini cycle shows why there may have been a mini cycle to start with, this was and is falling apart in the area pretty quick.
IWM 2 min with the cycle and the deterioration today after yesterday's weak showing.
IWM 5 min chart with the entire trend, it looks pretty clear in 3C and price action alone.
Here's the larger 30 min, 3C is clearly leading negative badly, note the rounding top. We seem to be rolling over.
As mentioned, before the mini cycle or as it was identified., but before prices moves, I noted 5 min positives in the Index futures, now look at the 5 min leading negative for ES.
This is ES 5 min
And I said it is through 15, 30, 60 min and more charts.
NQ 4 hour, nice rounding top, it's the process though, not the price pattern.
TF 5 min.
As far as credit among leading indicators
HYG vs the SPX even worse today, HYG's close yesterday is at the red arrow.
Note HYG's lack of enthusiasm as ES tried to move to VWAP around 2:45
Every time a positive gets started in HYG, it's just run over, I don't think the pros want to be holding it when things get ugly.
Junk Credit acted the same way today, no excitement at the EOD bounce attempt to VWAP.
No 3C attempt to get anything going.
As for sentiment which has been pretty reliable.
Yesterday's more bullish sentiment did NOTHING for the market today, it fell in to line today.
Our second sentiment indicator did worse, especially at the move to VWAP this afternoon.
As for VIX, I said yesterday it was unremarkable, today seemed to show a bid uin UVXY/VXX and VIX futures.
UVXY giving a nice clean reversal pattern with 3C support.
The 15 min VIX futures also caught a bid, I believe it can even be seen in spot VIX.
As for currencies,
This is the 1 day Yen 3C chart, if you read the articles linked on the members' site, you'll see that my opinion has been when the Yen rises, the market will fall with it, this triangle is very tight and 3C is very positive.
The 15 min $USD is a bit tough to call, it ran up on the bad NFP report and that's a QE off response.
When we look at the longer term though
The 4 hour chart looks like whatever noise the $USDX might see very short term, it's going higher, a QE negative signal.
As for carry pairs, they are the candlesticks, ES is purple...
The long term 4 hour EUR/JPY has clearly fallen away from ES, it's hard to imagine much support on anything other than a very short basis.
Intraday the EUR/JPY outperformed ES,
so ES couldn't even take advantage of the pair that has been lifting it since November of last year! It's the "Go to" asset to move the market and it can't!
Today it seems the $USD/JPY was a closer match, however
This pair on a 4 hour chart isn't offering much support either.
It really seems like they are running out of tricks, they whacked the Yen, it worked last week, didn't work this week. VIX smack downs aren't getting it done. Even a clear range RIGHT THERE isn't getting it done. Now Credit looks to have left the building and not even the carry trades can carry the market?
I do think we may have to move
very fast very soon, but until that point which will scream and jump off the charts, why would you want to trade this 2 + weeks of pure lateral chop, drifting down?
Patience is the hardest lesson for me and many of us, but it's also one of the most valuable.
I'll be back with more as I dig up more.


No comments:
Post a Comment