If someone asks me if I'm bearish or bullish the market my general response is, "I'm bearish", but that obviously is a broad remark because we've had a number of long trades over the last several months and even the last week.
To be more specific, I'm bearish the market in terms of the Primary trend (to come), I'm bearish the market's intermediate trend that has begun, I'm leaning bullish the short term trend, but right now I'm actually neutral the short term trend, so that's 3 different perspectives of the market all at the same time and often we are setting up trades in all 3 at the same time.
For instance, today I showed you how our Core Equity Tracking Portfolio (90% short) that has no options at all and only a handful of leveraged ETFs (less than 10%) is at an +11% gain for the week vs the SPX's -1.82% decline for the week. For me, considering the market hasn't even made a fraction of the expected downside move, we essentially have a Portfolio Beta (in a broad sense of the term) of over 6 (6:1) which is very high, that's a Beta that's higher than PCLN or XIV, thus far (and I was interested to see how it would perform with a halfway decent market decline) the picks and the positions put together at the time and place they were, seem to be excellent choices. As I said earlier, "I'd be happy to have a couple of stocks with that kind of a return relative to the market", but to have a broad TRACKING portfolio that has all kinds of different positions for different scenarios and most of all is WAY over-diversified (as over-diversification kills returns) I prefer to have about 6 core positions, I'm really happy with the performance.
However when we look at when and where a lot of these positions were opened, many didn't seem to be good areas to open them because of broad market timing, but positions like DE, IBM and recently AMZN, have been performing very well quite a while before the market has even cracked. This is why I don't think it's beneficial for newer members to try to copy positions we already have open because the idea is to enter the position at the lowest risk, the best price entry at a time of high probabilities. A newer member could enter DE right now and probably do ok over the long haul, but DE RIGHT NOW IS NOT A HIGH PROBABILITY, LOW RISK ENTRY, thus I'd prefer you look at newer positions that come up as they only come up when the climate for that individual stock is best.
I've digressed from the point, which is that multiple timeframe analysis may have us long some calls or a long/bull leveraged ETF and at the same time, entering or phasing in to long term core short positions, the trade depends on the timeframe. Our strategy and strategic positions depend on the big picture, but our TACTICAL entry/management depends on the short to intermediate term market analysis for the individual assets.
In other words we have a long term outlook (STRATEGIC) for the market and individual assets, but entering them and how we enter them is more TACTICAL and multiple timeframe analysis and expectations dictate a lot of that process.
Getting back to the look at futures, it's important to remember that short term charts are for short term trade or what I might consider "Tactical"means to effect a "Strategic" end, whereas longer term charts represent the strategic outlook, "Where I ultimately want to be positioned based on the probabilities for the primary trend or BIG PICTURE".
I'll try to point out some of the basic relationships and timeframes as we look at futures.
As you might recall from Wednesday night's "Daily Wrap: Not the Summer Doldrums" I felt very strongly that the typical Currency Carry trades like USD/JPY and AUD/JPY were not in any kind of shape to levitate futures overnight or lift the market Thursday,
"as for an engine, it's hard to imagine a carry cross doing the work, especially the $USD/JPY, maybe the AUD/JPY, but as you'll see, the JPY has some 3C strength that would make any carry cross driver difficult."
What has changed since Wednesday night? We have better confirmation between the averages as far as positive divergences go, Wednesday was completely disjointed and we saw that in relative performance of the averages and Industry Groups Thursday. Specifically speaking the market was VERY fractured and leaning down two very different paths in afternoon trade; the S&P and Financials looked better than The NASDAQ 100 and Tech and that was seen in relative performance today.
So we have better confirmation between the averages, although far from "solid confirmation", but that could develop in half a day and now we have the potential currency support that was absolutely not there Wednesday afternoon/night. This could have far reaching effects not only for direction of the broad market, but relative performance of assets like precious metals, oil and other commodities vs. equities. While I wouldn't say that currencies are showing strong confirmation that they could lift the market for a bounce, I am saying they look infinitely more capable than just a bit over 30 hours ago. THE BIGGEST EFFECT THIS COULD HAVE IS HOW WE TRADE TACTICALLY TO FURTHER OUR STRATEGIC GOALS.
*Before I get in to the charts, remember that tomorrow is expiration for August monthly options so we typically get an open somewhere pretty close to Thursday's close and a pin in the area with some slight adjustments until about 2:00 p.m. when most options are settled and there's less need for a pin, this gives the market about 2 hours to go off and trade the way it wants to without the restriction of the Options Expiration Pin.
Whether we get a SPY Arbitrage lift or not remains to be seen, but there are some hints regarding that as well. The main driver would typically be a Carry or former Carry position.

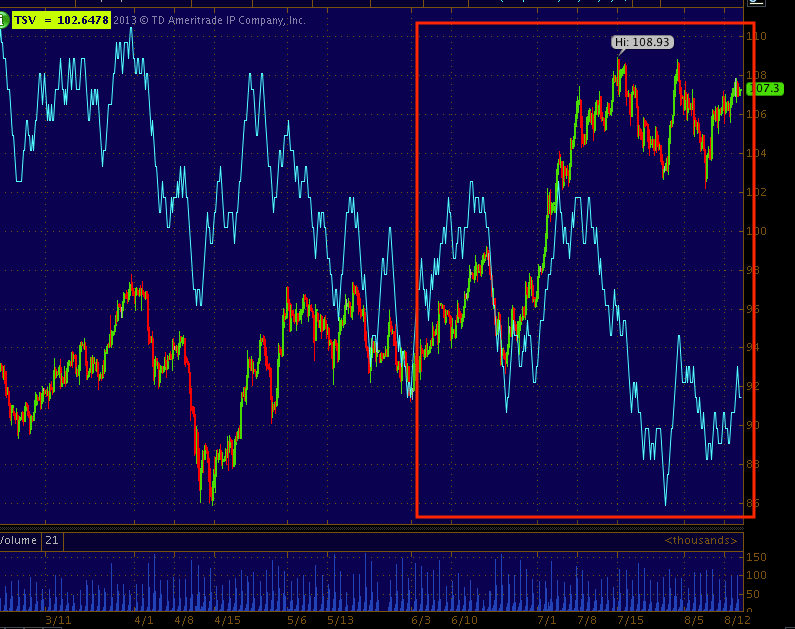
The Market started a new cycle after sliding lower since September 13/14th when QE3 was announced, it slid about 8% in to the SPX's November 16th lows and the new cycle started there. As you can see, the USD/JPY carry trade was already set up and moving higher at least a month before ES made it's final low on November 16th.
The Carry trade which was more of a basket of carry crosses including the USD/JPY, AUD/JPY and EUR/JPY (as they typically diversify carry positions in to a basket) moved along with the market with very high correlation, but something changed for the carry pairs. The AUD/JPY topped in April, the EUR/JPY topped in May and the USD/JPY topped in May as you can see above.
As shown in last night's Market Wrap, Market Breadth was clearly on the decline well before April, but just got worse (see Wednesday's Market Wrap for the 2 Breadth Charts showing a majority of stocks losing their 40 day and 200 day moving averages since February), this is clear evidence that market breadth was waving a bright red flag as internals were rotting from inside out and it's clear confirmation that the carry trades were being closed out.

What changed?

Nothing short of a miracle is going to bring the carry trade back, in fact it's just likely to get much worse, see my two articles linked on the member's site, "Currency Crisis" as one of my main theories back in April when they were written was between the carry and BOJ's QE on steroids (doubling the monetary base in 2 years) it would lead to the BOJ losing control over the most ambitious QE plan to date, JGB futures already have shown pretty clearly that the BOJ went too far in trying to fight decades of deflation with this enormous QE.
However, we don't need a Carry trade revival to get upside market support, just over the last few weeks the USD/JPY was levitating futures overnight and in to the regular session, the AUD/JPY took over for a day as I pointed out in this article early afternoon this Tuesday that another site was saying the USD/JPY carry cross rotated suddenly (on a dime) out of US equities and bonds and in to EU peripheral debt, using Spain as an example, I showed how it was just a short term rotation out of the USD/JPY and in to the AUD/JPY which they admitted later at the end of the day, the point is either carry cross can still support the market for short term moves. There was no evidence of either one supporting the market Wednesday, tonight it's a bit different.


Most of our pairs currency analysis is done with single currency futures, so lets take a look.

The Euro Futures are a great example of multiple timeframe analysis as well as a story book of the market short term to long term.

As a matter of fact, I captured this chart over an hour ago and just checking on the Euro just now, it has lost ground overnight as 3C was shoeing here in a clear range with a clear divergence.


The Euro reads like a story book of the market from building short term probabilities to long term realities.
The bottom line however still needs weakness in the Yen short term or at least relative weakness vs whichever cross (USD or AUD or maybe EUR)


Now the $USD as the most likely candidate and the currency with the most effect on other assets.


The 5 min chart is leading positive as well just like the Euro and the exact opposite of the Yen 5 min which is the confirmation we need, at least the start of it, for a USD/JPY sponsored market bounce, it's not a smoking gun, but it is a CHANGE IN CHARACTER as there was no hint of this Wednesday.
As far as the assets a rising $USD would likely effect, typically the legacy arbitrage of the $USD sends commodities in the opposite direction, take precious metals which we looked at Thursday...


Remember a stronger $USD, even if it is only short term, typically sends precious metals in the other direction, there has been an exception to this from time to time as the carry seemed to have more influence and for that the $USD needs to be strong, but judging by other charts, I'd say this is the most likely near term outcome.


Crude Oil- I've made no secret of the fact I think USO is setting up for a great short, it's more tactical than anything at this point, just a matter of the entry, when, where and what trade will work the best.


Even the 4 hour oil chart's negative divergence is clear, again, in my view it's tactical issues only that separate USO from patiently waiting and pulling the trigger.
If we were to see a risk on situation, we'd expect to see some pullback in VIX futures, VXX itself pulling back would be very helpful in supporting the SPY Arbitrage trade. Wednesday we saw a huge change in character in VXX and VIX futures, TODAY WE FOUND OUT EXACTLY WHY.
I wouldn't expect massive distribution, but perhaps a little price weakness, 3C charts today were not that week in these assets, but they didn't have the leading positives of Wednesday. Any move in VX for a market bounce only need be short term and not need to see any real distribution, IN FACT IF THERE IS A PRICE PULLBACK ON A POTENTIAL BOUNCE (the probabilities aren't fantastic, but much better than Wednesday or any other time over the last week +) IN THE MARKET, I'D FULLY EXPECT TO SEE IT ACCUMULATED AND THIS WOULD LIKELY SET UP EXCELLENT VXX OR UVXY TRADES.


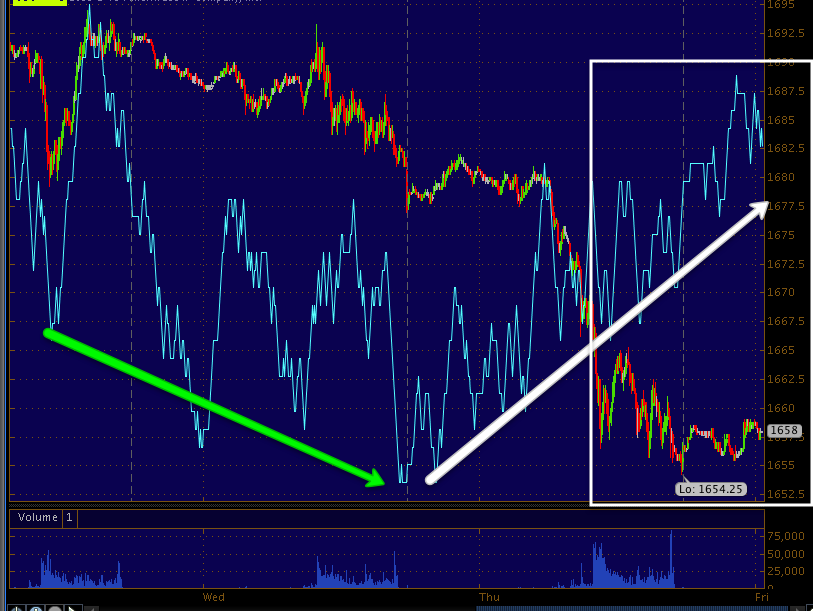
Last the assets that really matter are the Index futures, I wrote in Wednesday and Tuesday's "Market Wrap Posts" that there was nothing in any of the Index futures that has any sense of enthusiasm, today that changed. Typically a stronger dollar would send US Equities lower, but in this case (since November of 2012) a strong dollar has represented "Risk On" via the USD/JPY carry trade so this is one of those instances in which many people don't understand why the market rallies with the $USD, they don't understand the dynamics of the carry trade.
TF-R2K futures


NQ/NASDAQ 100 futures


ES/SPX Futures


Finally the big picture on the 4 hour chart.
Hopefully by seeing all of these assets and how the interact with each other and where they are positive or negative shows you a lot about the market and what moves it as well as the probabilities for near term action which determines our tactical actions as the big picture on all of these charts in clear, strategically we know what we want to do and most of us are done, but we can still use any tactical advantage to further our positioning.
I hope you found this useful.


No comments:
Post a Comment