Highlights
Natural gas in storage fell 287 billion cubic feet in the January 10 week to 2,530 bcf for the largest draw on record, just ahead of the 285 bcf draw in the December 13 week. A draw of about 300 bcf was expected. The heavy recent draws reflect this winter's heavier than usual weather.
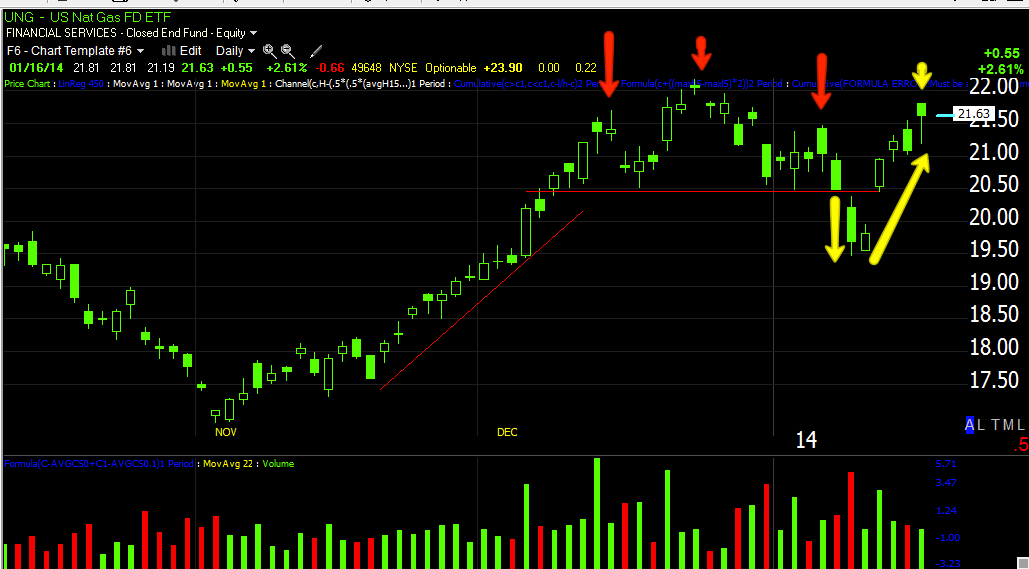
UNG daily chart with the H&S shakeout. Today's candle so far is a bearish hanging man.
This is the intraday data, the red arrow when the EIA report came out, as I thought, the cold weather had been discounted earlier in the week.
This is the chart we've been looking at and thinking DGAZ is a new long (trading) or add to, just wanted to wait for the report this morning, so far though, so good.
3C distribution in to the report. I'd like to see the 2 and 3 min charts migrate negative as well.
This is DGAZ 5 min, I think by the time the UNG 2 and 3 min charts migrate negative, the rounding process will be mature, this morning represents the head fake move so I'd say DGAZ is pretty darn close to an excellent long entry/add to.
DGAZ 1 min confirming UNG.
I'll jeep an eye on this, but I wouldn't have too much trouble adding now, but I'd prefer to wait just to have all the ducks in a line, but I also already have significant exposure in DSGAZ, if I didn't have any, I may act faster.
|


No comments:
Post a Comment