First understand that with a head fake move, it's truly what is sounds like, it's a move to fool people and it wasn't a week and a half ago that the motto was "Short the rip" or Sell the Rip", replacing, "Buy the dip", investors got too bearish too quick.
January 24th we had quite a few posts that made it seem reasonable that the following week (starting with Monday Jan 27th) we'd see a range start early in the week.
"That's the gist of it, unless there's a fundamental surprise, I don't see any "V" shaped bounce, the most likely thing would be lateral trade early next week "Jan 24th...
That lateral range looked like this...

Our Friday afternoon post on Jan 31st, "Come Monday" which was the last day in the range made a prediction for the following Monday based on 3C's closing and mass psychology or market behavior...
"Ultimately though it came down to the 3C concept of "3C signals picking up where they left off on the next trading day" whether that be the very next day or over a 3-day weekend.
The other concept that has very high probabilities is that of a head fake move before a reversal or in this case, before a breakout from the week's lateral range which is normally at 80% of the time. The longer the defined range is, the more probable a head fake move is to occur and we had a week long defined range.
The Bellwether stocks were in agreement, which makes long entries in them very enticing on a head fake move, that's actually the best entry we can get as far as price and profit , risk and timing since a head fake move occurs just before a move.
Since the major concept and most probable concept that will likely define the start of trade next week and the move that comes after is almost solely the head fake move, I think it is of utmost importance that you understand what this move is, why it occurs, what the signs of it are, what the effects of it are... "
That move, the next Monday, looked like this...

To the left is the defined range of the week before, the red arrow is Monday, the head fake move we called for. The reason it is a head fake move is because it did NOT continue lower, it was enough to hit stops and draw in new shorts, but after that they were caught in a bear trap as we made a "W" base the next couple of days.
I described what the following Head Fake move would look like several times... See if this sounds familiar and note the dates, both BEFORE ANY UPSIDE MOVE.
Market Update January 31st.
" And of course the 60 min charts leading positive for Index futures suggests we see a strong bounce and there's no other reason to set up a bounce unless it's going to be strong, it is there for a specific purpose and to fulfill that purpose it needs to be strong, convincing, it needs to get dumb money bullish and buying. Should things go the way we expect, I'd expect the following week's insider selling to be even higher."
Tuesday February 4th
" When I said we expected a head fake move in my Friday post, "Come Monday", it was a head fake move to the downside, they need to be real, they need to be convincing, just as a bounce to the upside, I wouldn't expect a 1 or 2% move, I'd expect something that will fill my inbox with emails asking, "Are you sure the market is still bearish Brandt, this looks awfully bullish"."
I think you know what I expect next, but to give you some idea of how we closed, take a look at the QQQ (NASDAQ 100)...

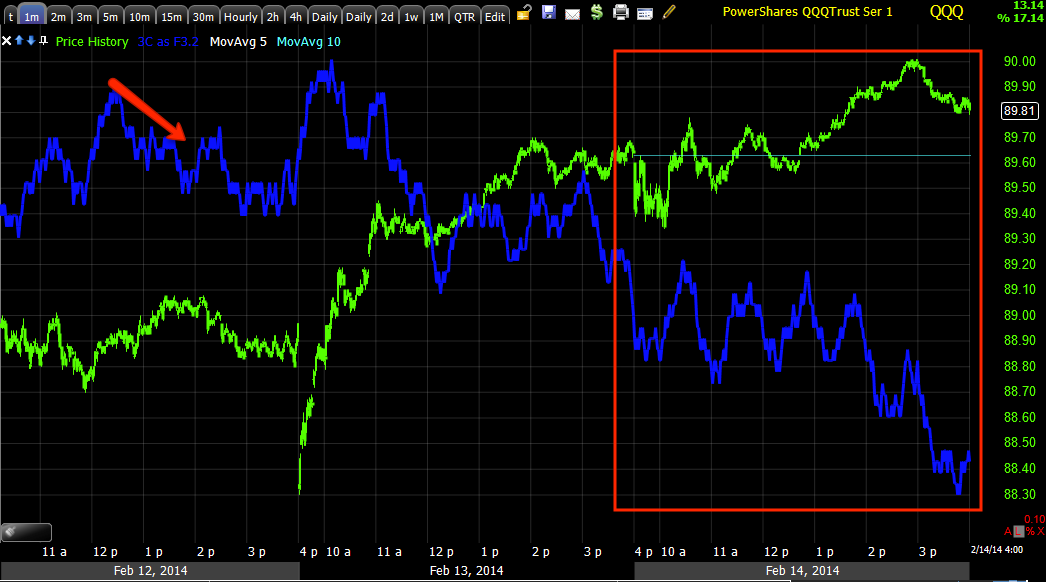


Now look at the negative divegrence to the left and how big it was and how much damage it did, NOW LOOK AT THE CURRENT LEADING NEGATIVE DIVEGRENCE, NOT ONLY IS IT A LEADING DIVEGRENCE VS. A FORMER RELATIVE DIVEGRENCE, BUT IT IS MUCH SHARPER AND LARGER, IMAGINE WHAT THIS WILL DO.

The up move or what we were identifying before hand as the expected sub-intermediate trend (which this is) was represented in the Q's on the 10 min chart, as I showed early this morning in the SPY, that timeframe is falling apart as it has here.
Initially I had thought the sub-intermediate timeframe would hold its positive divegrence right through a downside reversal and a break below the SPX's 200 day moving average, that's obviously not going to happen as the long timeframes are quickly falling apart. Here are the SPY and IWM versions which had been either leading positive or perfectly in line with the trend.

SPY 30 min negative divegrence from a formerly leading positive just days ago.

IWM 30 min negative divegrence, also not holding up and falling apart quickly.
And remember what came after the Sub-Intermediate Trend, the one we have just been going through...THE PRIMARY TREND SHOULD REASSERT ITSELF...

I compared this QQQ daily chart to the 2000 Dot.Com Bubble which I'll repost at the bottom.

QQQ daily leading negative as sharp as it gets, this is on the same scale as the Dow 1929 chart I have posted.
QQQ 1999-20000 Dot.Com Bubble.

1999-2000 QQQ Dot.Com negative divergence. Which looks worse to you?
Now you know why I felt it prudent to spend some time cleaning up Core / Trend positions and establishing new ones.
As for the P/L on closed positions today...
UPRO
I felt like I needed to just clean up core positions and take the gains here and open up a new keg of dry powder for new positions that need to be entered quickly and at the right spot. The P/L with a fill of $93.69 came to a gain of +16.7%
BIDU CALLS
These I could have closed earlier for much smaller loss, but I was busy catching up with the market, the P/L came to -23.8%
UNG I took partial profits in...
NUGT
I didn't like the looks of GDX and needed to free up resources for new positions so I figured take the small loss and put the resources to work in a better looking asset.
NUGT's P/L came out to -4.6%
I'm sure I'll have more for you after I go through the nitty gritty, but I'm liking the idea of filling out core / Trending positions ASAP.


No comments:
Post a Comment