I'm not a big fan of the leveraged short gold ETF/ETNs, their volume is pretty thin, DZZ is a 2x short gold ETN that has the best volume of the choices available. There's also a pure GLD short or Puts, the way things sit and considering a I have a DUST position (3x short gold miners) in the core tracking portfolio (but consider it more a trade than a trending position), I might be inclined to add some exposure to the trading portfolio which is equity positions only, no options. However if there was a good options set up, like a fast run up intraday with obvious and deteriorating negative divergences, I may consider GLD Puts, it all depends on if the move up intraday would be enough to bring premiums down.
Here's a review of GLD and the set up I'm looking at...
Remember, before February we had a lot of success trading GLD with options, if GLD looked positive the market was likely going to go negative and vice-versa, they had a short term inverse relationship which made it easy to confirm GLD trading signals on a short term basis, on a longer term basis, GLD is transitional and choppy and not a good trending candidate, or at least it wasn't, but that is going to change.
As for the correlation which you can see above (GLD in green, SPY in red), it flipped and they moved together on a short squeeze, I think this was a temporary change in correlation and the primary trend correlation will most likely revert to an inverted (opposite) one.
I also think GLD is going to be a nice longer term trend position (long), but not just yet, however a pullback may be the perfect set up for us to get involved in a core GLD long trend trade.
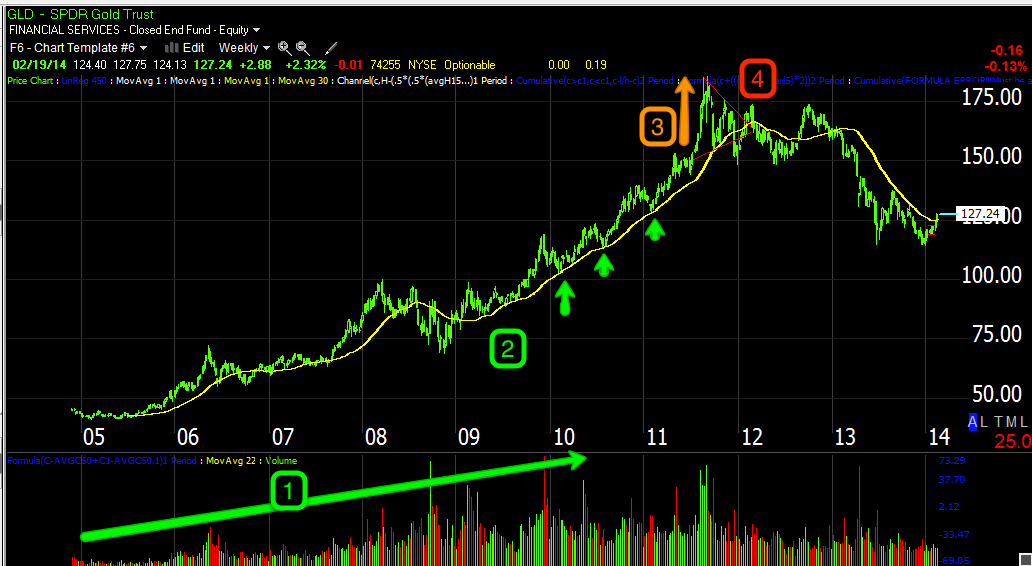
You may recall when EVERYONE was a goldbug, gold could do no wrong under the QE/Dollar destruction Bernanke regime.
At #1 we have the normal / healthy price/volume relationship in which volume builds as price rises, you'll notice the market since 2009's low has not had this healthy volume relationship and while it wasn't a problem over the last several years, I do think in the end it will come home to roost.
At #2 we had a very predictable entry at the 150-day moving average (even though this is a 5-day chart with a 30-bar moving average), a pullback to the 150-day was a great entry for long gold positions and you may recall in 2011 we were looking at a long position and then I saw the increased ROC in price at #3, which always looks bullish, but it is a change in character and one most often seen as stage 2 transitions to a stage 3 top so in many ways it's a red flag to tighten up stops and start taking profits. Then came the triangle, it was way too big to be a consolidation and large triangles like these function as tops and bottoms depending on the preceding trend, in this case a top and we waved off the GLD long trade idea.
You may also recall we called a top in GLD right then and there when it was most popular and goldbugs were worse than AAPL longs, at the time I had said I expected an intermediate downtrend at minimum and maybe a primary downtrend, I'd say that call was right on.
This is a daily chart of GLD which we noticed a while back was putting something together, in the early stages I assumed it was a counter trend bear market rally, but the base grew larger and now it looks to be more than just a counter trend rally that will emerge from this basing which by the way looks like a bearish descending triangle so it's entirely possible (even though it is too large to be a true consolidation triangle) that retail traders will see this as a consolidation/continuation pattern and expect a continuation of the preceding downtrend, this gives us a possible downside target for a swing trade (short) and a possible target to open a trend long position.
That target would be below the base or a new lower low as retail T.A. traders already would see the price pattern as bearish, but they won't engage short positions until they get confirmation in the form of a break below support of the triangle, that's where a swing short in GLD may end up and a new trend long position considered...likely around $110-112.
This is a close up of the daily chart, note the gap and 3 small bodied candles indicating a loss of momentum and opening GLD up to a downside reversal as these are considered bearish reversal evening star and doji stars.
When I said the long term trend looked very good (bullish), this is the daily 3C chart, that's a nice leading positive divegrence, but that's only part of it.
The entire trend from the triangle with downtrend confirmation to the first positive divegrence in which I suspected a smaller counter trend rally has turned in to a larger leading positive divegrence/base so the descending triangle in price is very deceptive for any shorts jumping in on a head fake move below support ( a new low for the trend).
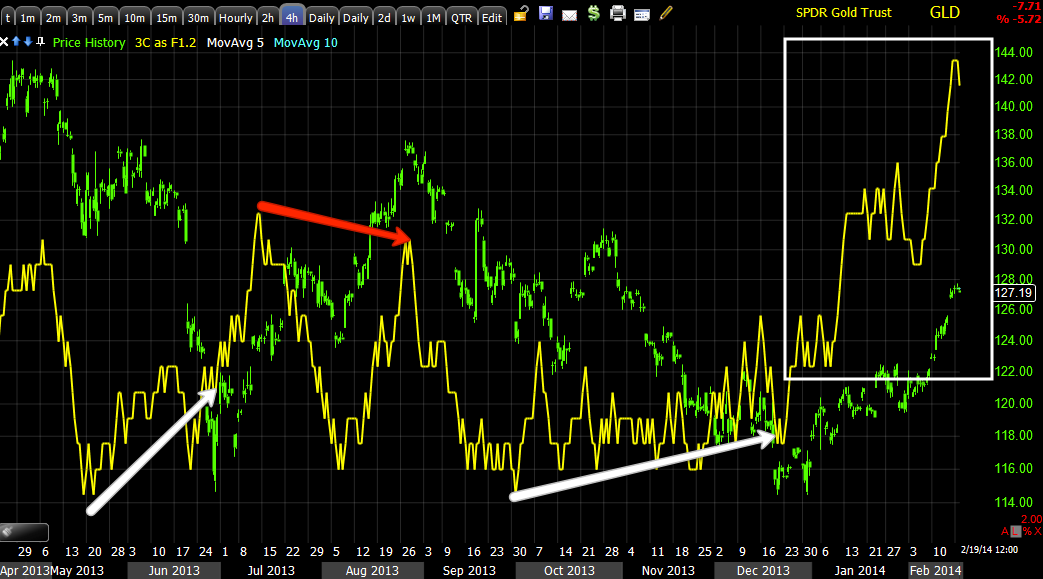
The 4 hour chart also shows a strong leading positive divegrence, this is mostly in line with the same move the broader market made.
The 30 min chart is falling apart now as you can see it leading negative and that is migrating from shorter charts.
Like this leading negative 15 min chart so we already have a strong signal for a short (sale) swing trade.
The 10 min chart was feeding the 15 min, it has a sharper leading negative divergence as it should and in what has been a rather flat range, these quiet areas (flat) are where we often see the most underlying action so they are deceptive and catch people off guard, but this is how Wall St. works, they aren't going to show you their cards unless they want you to see them.
Intraday the 1 min chart has a positive divergence, I'd like to see it look stronger (right now it's weaker than this, but still positive).
A large flush of volume on a hammer or some other bullish candle intraday would set up a short entry or a put position.
The 2 min chart has this small intraday positive and it's still working, so once again, I'd like to see an intraday move up to short in to rather than chasing the move on the downside.
The 3 min chart is damaged significantly since the gaps up and is part of the migration process, this won't repair, it may get to an intraday positive, but it won't repair the leading negative damage.
I'm going to set some price alerts just above on an intraday basis, maybe up to the recent highs and then look at the intraday charts to see what kind of entry looks best, (GLD short, leveraged short ETF or Put position).
I wouldn't be surprised if the F_E_D / F_O_M_C minutes at 2 p.m. create the opportunity as gold is very sensitive to F_E_D actions and statements and there's often a knee jerk move when they first come out, that may work to our advantage.
Is interest rates about to start going up?
-
Yes, I know - it does not make any sense - FED is about to cut
rates...but....real world interest rates are not always what FED wants it
to be.
6 years ago


No comments:
Post a Comment