Yesterday in the End of Day Report EOD Update I started it with,
"As far as 3C signals, today they were as you'd expect for a head fake move which would just be a run above the rounding top that was already in place, the head fake move itself occurs about 80+% of the time before a reversal in any timeframe, whether you are looking at 15 min charts, 5 day charts or intraday 1 min charts. The head fake move is one of the better timing signals we have when we already know there's an underlying trend of distribution or accumulation."
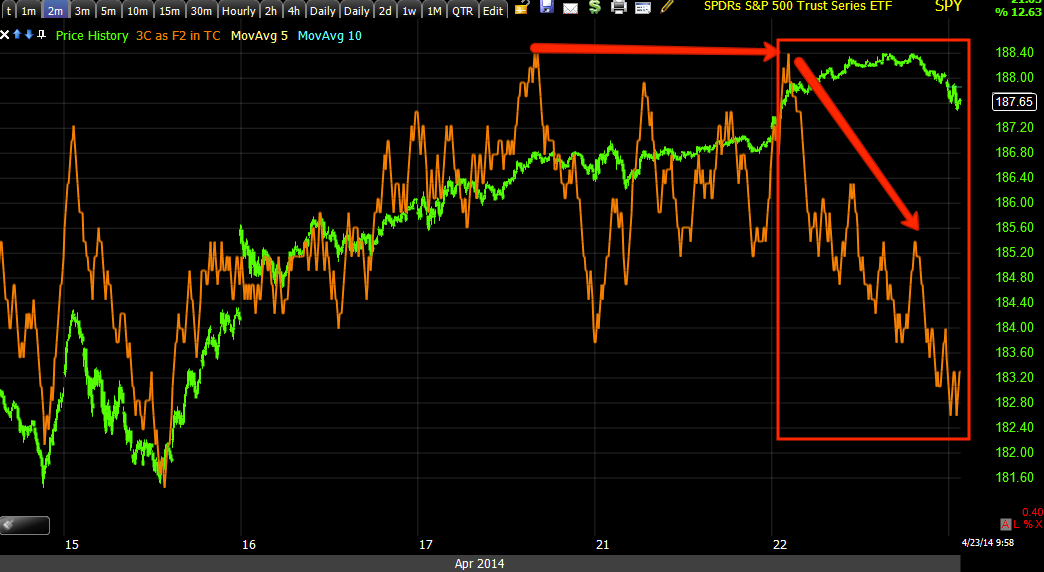
Looking at the SPY charts, it's amazing how clean the signals for a head fake move yesterday were. You may recall that I decided to leave what was already established for a move down in place rather than add to it at this time because some targets on the upside had not been taken out. Looking at the charts all I can think of if, "please give us a little bounce" because with that I believe we will have a larger opportunity to play the downside move in greater size with the charts and objective data to back up that kind of decision, perhaps a bounce to the targets I talked about that were missed in a couple of the averages yesterday. From certain charts, it looks like that "may" be a possibility, lets just get to the charts so you can see for yourself.


Remember the 60 min chart is already trashed, there was no positive out to that time frame so it's just the 30 min.
The QQQ and IWM look the same, although I won't post all of the charts...


And why might we get a little bounce?


I'm not saying the 3 min or longer won't go positive, just that they are not now, the important thing is the 5, 10 and 15 min charts and how bad they look and how quickly that happened.
I'll keep you up to speed, for now I'm not making any changes in positions.


No comments:
Post a Comment