Friday March 28th we opened some XLE (Energy) April $90 puts,
Opening XLE April (Standard monthly) $90 Put.
I was considering closing those out today as a short term bounce would likely send them lower, but I suspect we have enough time to make them profitable as the premium has dropped since earlier this morning.
Here are the charts for XLE,
I will hold the position open for now.
As for the very short term, that's the only reason I'd consider closing the position; we have a nice rounding process, what looks like a little head fake move, a positive divegrence, but this is all still just intraday charts like the broad market tone.
There's not much migration to the 2 min chart at all, the averages look much better and they are still very speculative.
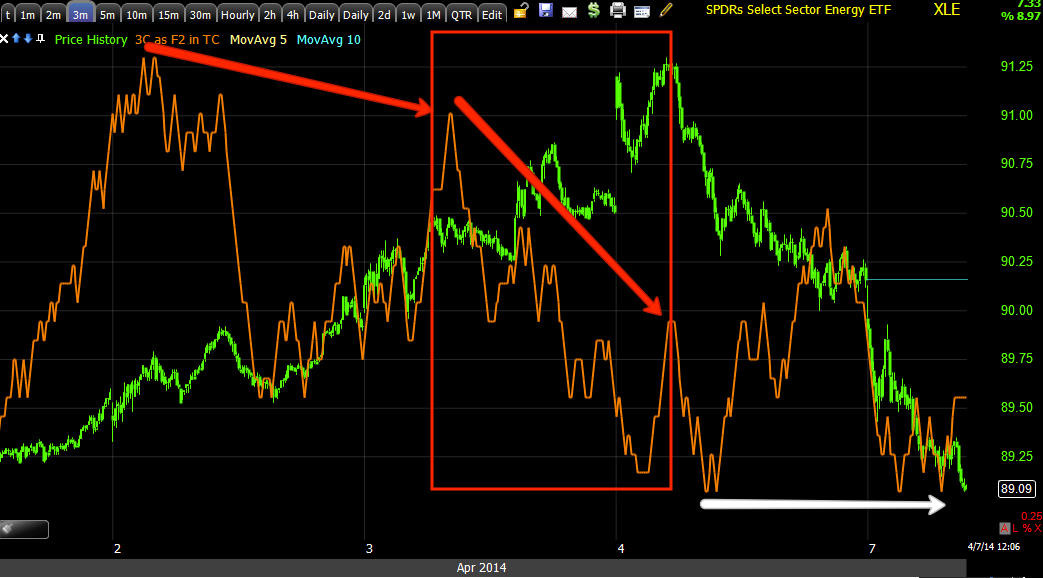
The 3 min chart has a relative divergence which is the weakest form, but it's large enough for a bounce, I might consider adding to an XLE short/Put position on a bounce, however if I added to puts I'd want to extend the expiration in to May.
This 5 min chart pretty much speaks for itself, as far as the bigger trade here...
Any bounce in XLE in my view should be used to short in to, this 15 min chart is one of the stronger timeframes for underlying trend action and this needs no notation on the chart, the leading negative divegrence at a new low is VERY clear.
I think the April monthly puts have enough time considering HOW BAD this chart looks.


No comments:
Post a Comment