I think this SPY chart shows us where we want to be in position. The TICK chart below it shows us what is happening to market breadth on today's gap up which is a prerequisite for any number of good (bearish) candlestick reversal patterns.
The USD/JPY Carry trade charts fit right in there as well and even VIX Futures fit in neatly. Even gold's correlation fits well with the market and forward expectations/timing.
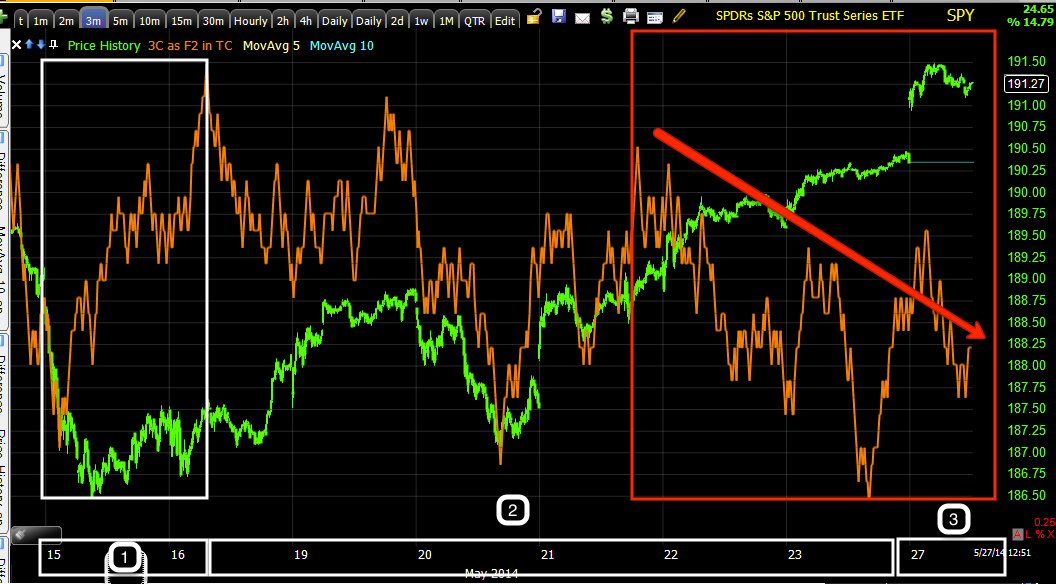
This 3 min trend chart shows the Friday previous to last #1, that's when we had a bear flag and expected a Crazy Ivan shakeout on both sides of the flag, the one below the flag would be the momentum (short squeeze-which we saw last week in a lot of momo stocks). At #2 we have the actual Crazy Ivan in the SPX below the flag after an initial failed breakout and then the move above the flag the rest of last week. The 3C chart shows pretty clearly what was being done with higher prices.
However conceptually (our concepts), it had been mentioned numerous times that this multi-month range/top would be a VERY high probability area for a head fake move, especially because of the size of the downside reversal that the size of the range forecasts.
#3 is this week which I believe is the resolution of the entire bear flag/momentum driven move that has clearly been sold in to.
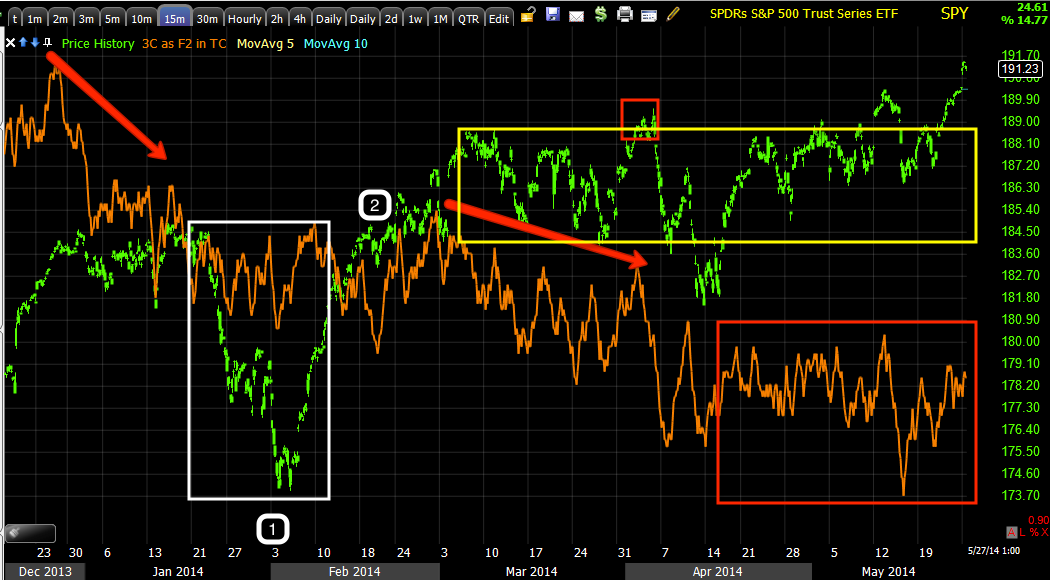
The 15 min chart's trend shows the distribution and accumulation right before and in to the February cycle and #2 is the actual stage 2 (up-trend) of that cycle. The lateral trade in yellow has been the large multi-month top/range that is a very high probability head fake move before what would be a substantial downside move just considering the size of the range alone, not to mention the continued leading negative 3C divegrence.
This is a close up view of the 15 min chart, this is where we are negative and beyond, the 1-3 min charts are negative, today is extra clear on that point in most averages, although each has a lot different relative performance, which seems to be an effect of the F_E_D weaning the market off POMO/QE as everything use to move together in lock-step.
This is the SPY 5 min and below...
The SPY 10-min. I think as the 3 min chart continues to deteriorate, the 5 and 10 will see migration and that's essentially the key to timing.
3 min chart with the bear flag which would not have shown a positive divegrence if it were a true bear flag rather than a set up for a Crazy Ivan/head fake.
This is what the SPY looks like today (to the right in red) compared to the NYSE TICK, more stocks are moving down than up and that trend continues to accelerate.
It's also clear on my custom TICK/SPY indicator.
As for the other averages, they are seeing the same intraday action on today's gap...
DIA from the Crazy Ivan move down and what the market has done with higher prices based on the momentum from that Crazy Ivan in DIA
Note today's action especially.
This is migration of today's action in DIA.
The IWM saw a very ugly earlier divergence, there's an intraday positive, I'm not sure what that is moving toward yet, but it's still intraday only.
And IWM wider negative divergence migration of today's action.
QQQ intraday in to a flat range oin the gap up and a leading negative divegrence.

As far as the VIX Futures...
They are being accumulated, smart money seems to be getting a bit nervous, we saw this last week in VXX/UVXY, the timing is about right as well.
The new contract is positive out to 60 mins.
VIX futures 60 min positive already.
And spot VIX, as I said last week, it's simply not going down as demand is real.
This is spot VIX (green) vs SPY (red ) today, spot VIX is up +2.46% and up with the market gapping up, that's not the normal correlation at all.
As for the USD/JPY, as mentioned, the Yen is positive from 15-60 min
Yen 15 min positive, 30 min is positive too...
As is the 60 min.
$USD was negative from about 5 min to 60 min, none of this bodes well for USD/JPY, therefore it does not bode well for Index futures or the overall market.
Since earlier, now even the 1 min $USDX has gone negative.
And negative in a big way all the way out to the 60 min chart.
I think the timing key is simply the migration of SPY 5 and 10 min charts going negative and that links the intraday which are in very bad shape on today's gap up, with the longer term starting at 15 min.
The USD/JPY and VIX are confirming. I'll have to see what Leading Indicators show, but I don't expect anything different as this seems to be the resolution of the bear flag momentum move, which is pretty weak for the market in the first place that a sling shot short squeeze based on a bear flag had to be used as every other lever has broken down except USD/JPY and you can see that is quickly falling apart.


No comments:
Post a Comment