Last week, the whole week we were watching USD/JPY and the $102 mark, I can't remember how many times it was said, "USD/JPY > $102 is the key to the market right now".
So we saw $102 blown through on the open of regular hours this morning, you can take a look at the FX charts/divergences from earlier today and compare to now if you like, they are here in
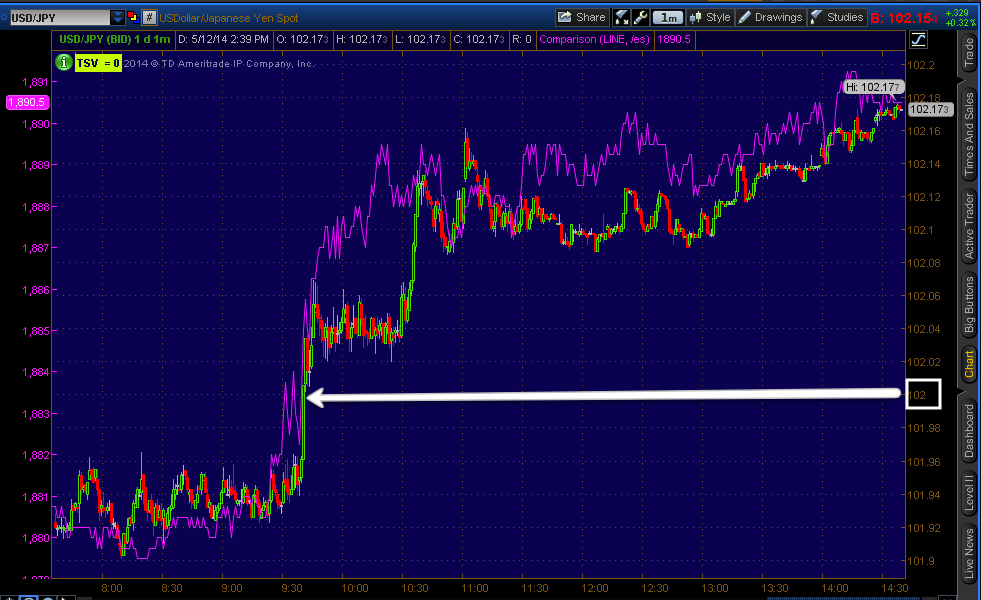
USD/JPY $102 Update
I'm not posting many if any Yen charts because they are all either in line or moving positive so there is some difference between them now and this morning, but the larger, more noticeable differences are in the $USD and to an extent, the $USD/JPY pair.
As expected, the USD/JPY pair (red/green candlesticks) vs ES/SPX futures (purple) are moving together since the open as we had expected all of last week, thus the reason the psychological level of $102 was so important for us in the $USD/JPY and why we knew it would be hit as it would be pulling price toward it like a magnet, it would also be a great area to create a sham, a bull trap, whatever you want to call it, but we aren't here by accident.
The 1 min USD/JPY shows several intraday negative divergences as well as the ECB comment (I'm guessing it was around the time the European markets opened) and even though we usually don't get very good pairs signals beyond 1 min...
We even have a 5 min USD/JPY signal which is not common and VERY rarely do we get a 15 min signal...
However the USD/JPY looks to be largely in line at most areas until we see a move higher where we have a negative divegrence as we expected to see on a move above $102.
As for individual currency futures, as I said, there's so little change in the Yen there's no point in posting them, but they are either in line as some were and some are looking better as we could see earlier today,
it appears any movement or underlying action is taking place in the $USDX below.
The 1 min $USDX intraday negative
This 5 min $USDX negative is a much bigger deal and looks a lot like many of the averages, for instance...
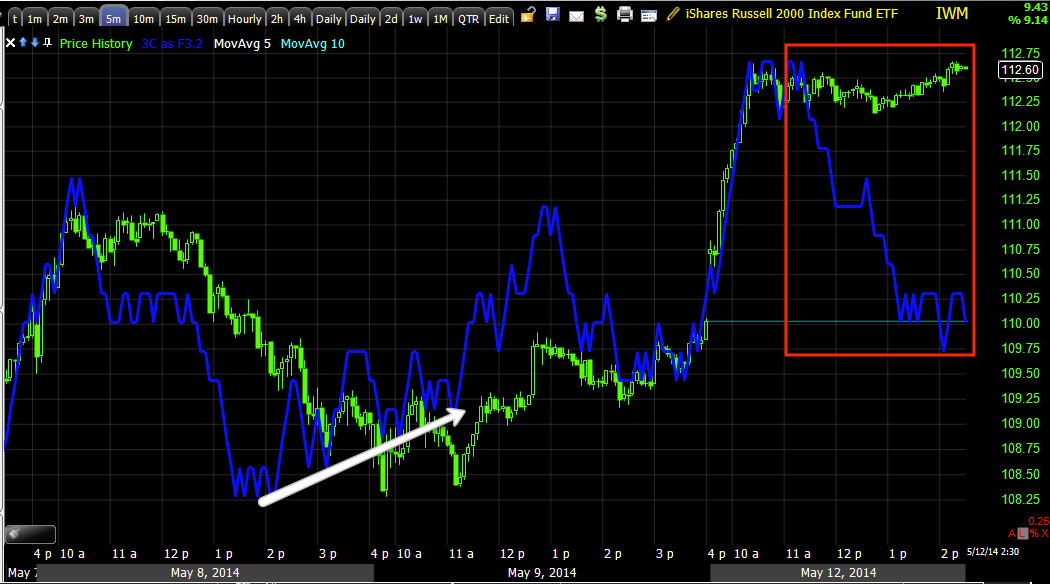
The IWM intraday on the 5 min chart and as I mentioned earlier, the DIA...
5 min DIA.
I also said the DIA looked particularly bad...
This is the 5 min chart in scale to the shorter of the 3 cycles that started 4/28,
remember I said there were at least 3 cycles somewhere either in stage 3 or some variation of late stage 4...
This is the DIA 5 min chart showing the medium (longer term) middle trend -note the 5 min chart's divegrence. This was around the 11th of April to the 14th (base or stage 1) and finally...
The February Cycle which is the long term cycle, I can't get all the way back to the 3rd of February when it was still in stage 1, but you see the different stages, "4A" is the shakeout after the initial break to stage 4, again look at the divegrence. This is what I think is very unique for multiple timeframe analysis and on a larger scale, multiple trend analysis.
Back to the $USDX futures...
The 15 min chart is leading negative for the new week.
As is the 30 min chart.
The strongest chart for $USDX was the 60 min, it still looks the same as the earlier post today and will be a key timeframe, but it takes a while for a divergence to move to a 60 min chart.


No comments:
Post a Comment