The triggers I set for both GLD (
as a put trade similar to yesterday's SLV $20 July Put, Trade Idea: (Short Term Spec. Options) SLV Puts) and GDX/NUGT didn't see too much action today, I think maybe one NUGT went off, but nowhere near what I suspect we'll see when the position is ready.
I am not eager to move out of NUGT (I already took most of the profits off the table +46% Monday, what's left of the position that was cut in half Monday is still at a +40% gain) as well as it has performed and as long as we have been watching this one for the right places to enter,
but I'm less eager to potentially watch those gains of 40% suffer draw-down when the resources "could" be used to make another 30 or 40% rather than wait out the draw-down/pullback.
GLD as a put trade similar to the SLV Put from yesterday
(linked above) which is at a -9.4% loss today (
not that bad as options go) seems to look even better so while I'm not in a hurry to have 3 positions all with the same exposure (
meaning SLV puts, GLD puts and DUST long would likely all move together directionally and that's a lot of exposure to one sector) the bar I've set for such a set of trades is pretty high as far as the entry goes, if it doesn't set up just right and at the best possible area, I'm ok missing the trade if need be rather than take sub-optimal positions with that much exposure.
So here's a brief synopsis of what I see in the positions and what I'm looking for to make the exposure worthwhile.
Since calling the 2011 GLD top, as GLD has trended down, the first positive divegrence on a daily chart I suspected would be a counter-trend rally as GLD was already in an intermediate downtrend
(#1), however the bounce from there was not of the caliber of a counter-trend rally and by the time we saw the second leading positive daily divergence (#
2) it started to become clear we may be dealing with something bigger than a counter-trend rally, perhaps some near term base in GLD. By the time we made it to the range just before
(#3) and the head fake below it that sent 3C in to another leading positive divegrence, it was clear that we were looking at a new base in GLD, potentially a primary bull market.
The point being, I don't take GLD shorts/puts lightly.
This is the area labeled as #3 on the chart above, a range within the base and a head fake move below the range which saw very strong accumulation as you can see by the leading positive divergence. The move from the head fake (we commonly see head fake moves about 80% of the time just before a major reversal) has been exceptionally strong, sending GLD to 2 month highs with a solid 3.5% 1-day breakout gain on huge volume, still way underperforming our recent favorite, GDX/NUGT which have seen +19% and +66% gains respectively over the same period. This is obviously one of the reasons I believe we are starting to see pre-QE relationships start to re-emrge after being absent for about 5 years.
However, no matter how strong the gain, consolidation of those gains, wringing out the excesses and the weak hands is a good thing for the longer term viability of the move.
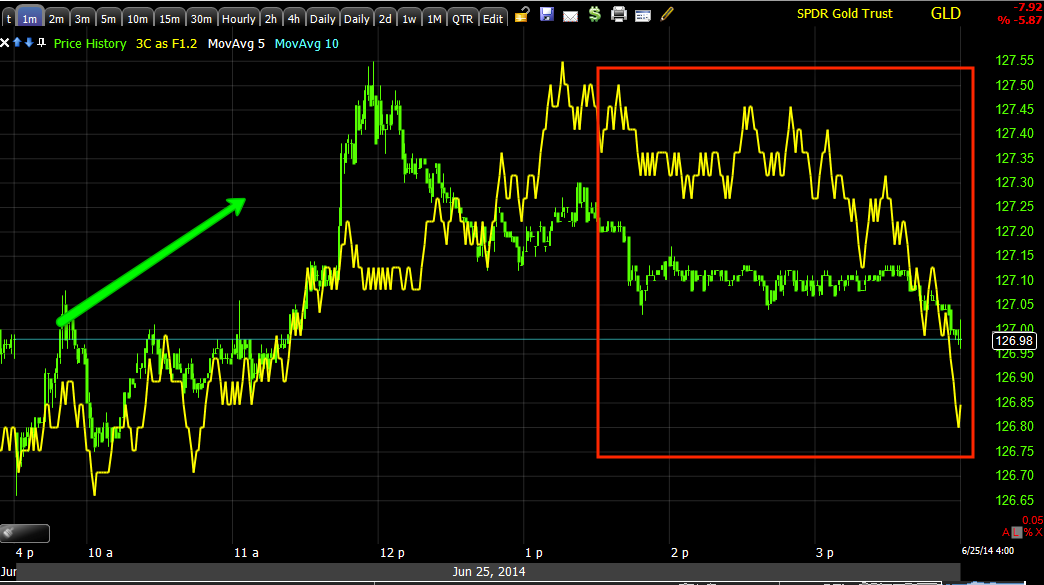
This GLD 15 min chart in a flat range after a near parabolic move up is a signal I take seriously, although I suspect it will be a constructive pullback/consolidation which will offer us great positioning on new or add-to positions with solid confirmation of accumulation during the pullback, the question is, "Can we make a tidy sum on the pullback as well?"
This is another example of a pullback signal on GLD's 10 min chart with a leading negative divegrence in the middle of a range where divergences are often seen.
Even a 5 min chart gives virtually the exact same signal, also confirming the concept of migration of the divergence or seeing evidence that the divergence is growing in strength. Still, as bad as these may look , compared to the 60 min, 2/4 hour and daily charts, it clearly seems to be little more than a pullback, even though they can be sharp, thus the question again is, "Is this a reasonable risk/reward set-up?"
Both GLD and GDX/NUGT (gold miners) have recent positive divergences in the 3- 5 min range that suggest they are not quite done and not quite ready to start their pullback such as the 3 min GLD chart above.
I'd expect those 3-5 min positives to deteriorate before the positions (GLD puts, selling NUGT and opening DUST long) are ready, as usual, new divergences (a negative to take out the longer 3-5 min positives) will start on the earliest timeframes as it appears GLD started to see later today on this 1 min chart. When the 2 and 3 min are looking similar, we should be at a high probability/low risk area.
NUGT (3x long GDX/Gold miners)
NUGT also has a strong longer term chart as can be seen at the left with a leading positive 30 min chart, but the exceptional move over the last 3 weeks or so has left it a bit over-extended and the 30 min leading negative divegrence gives me good reason to take gains off the table and perhaps even play the pullback trade via DUST long.
Again we have a 5 min positive divegrence in NUGT that suggests its upside move or at least its timing is not quite there for a position or closing this position in its entirety.
Like GLD, the 5 min positive above should see deterioration on the 1 min chart first and then migrate outward to the longer 3-5 min charts, I didn't see as much of that in NUGT today as the 1 min chart above is a little more positive than in line.
This is essentially all I'm waiting on, timing signals,
if I miss them on an overnight surprise, I can live with it, what I can't live with is taking the trade out of greed or fear that I may miss it when it's in sub-optimal position.
I expect that we'll see deterioration here tomorrow as GLD is already showing some.


No comments:
Post a Comment