Friday I put out a VERY short term IWM bounce trade idea,
Trade Idea: Short Term IWM Calls .
This was a 1/2 size spec Call position ($115, expiration this Friday 20th). Right now the position is in the green, but in the single digits, about 7%. For now I intend to continue holding it, the idea from my point of view is that the trade should be wrapped up no later than the F_O_M_C Wednesday at 2 p.m.
Here's what we have in the IWM, there's 1 chart causing some concern, but I'm not sure it's enough to warrant exiting the position.
First the strongest chart for an IWM bounce would be the 15 min Russell Futures positive divegrence, it's a 15 min chart, but a small divergence...
TF 15 min, I showed this chart this morning in the A.M. Update.
Intraday, the action has been pretty stale, we saw that initial negative this morning on the a.m. high and everything since has been in line , however, this next chart is causing me some concern because of the concept of migration, but I think it's such a short term timeframe and would take a bit more to become something more bothersome, I'd expect the trade to be over with by then.
In to this afternoon, the 2 min chart has broken down, leading negative. The same has happened in the QQQ 2 min , SPY 1 min and DIA 1 min.
As I said earlier, this bear flag is not showing the same positive character that the one from mid-May did which is what caused us suspicion that it would cause upside momentum which it did, right through the top of the multi-month range.
So far the 3 min chart which saw some accumulation on a head fake below support, has remained in line, if migration of the 2 min negative reaches this chart, I'll be looking to take more action and not just in that IWM call position.
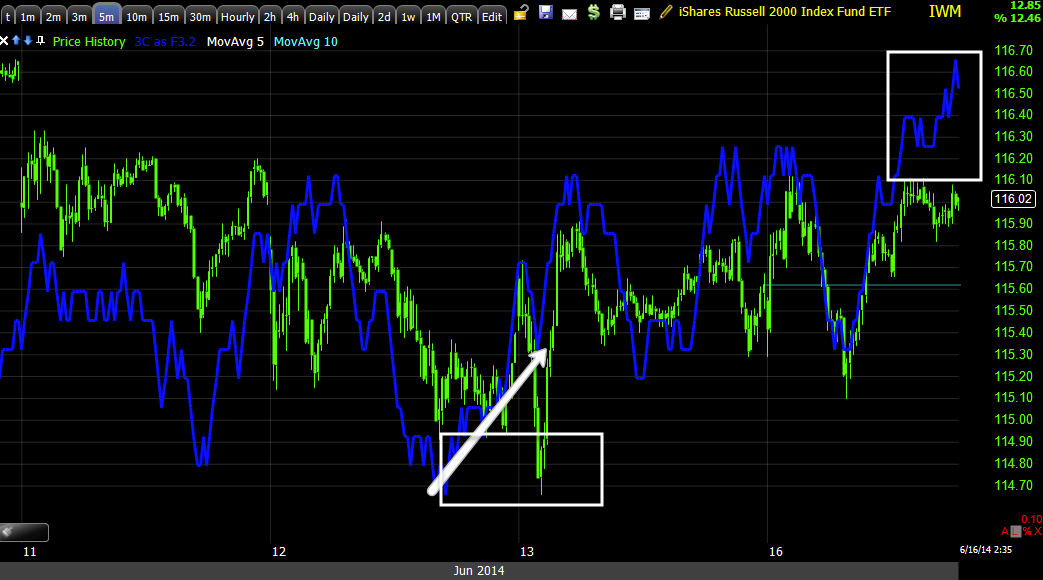
The IWM 5 min shows the same accumulation of a stop run below support tested 3 times in an afternoon, there's a very slight leading divergence now, but this could just be a bit of noise in the chart, it's not anything jumping off the chart.
As for the IWM 10 min, this is why it was a short term call position expiring this Friday rather than a longer one.
The trend here is leading negative, if I were to zoom the chart to intraday view, the area in yellow (today) would be perfectly in line with price, so it seems beyond the accumulation on the head fake stop run, there hasn't been much else and that 2 min chart in most of the averages is bothersome.
I'll of course let you know if I make any moves before I make them.
This still looks like the resolution of a head fake move above the multi-month range/SPX 1900.


No comments:
Post a Comment