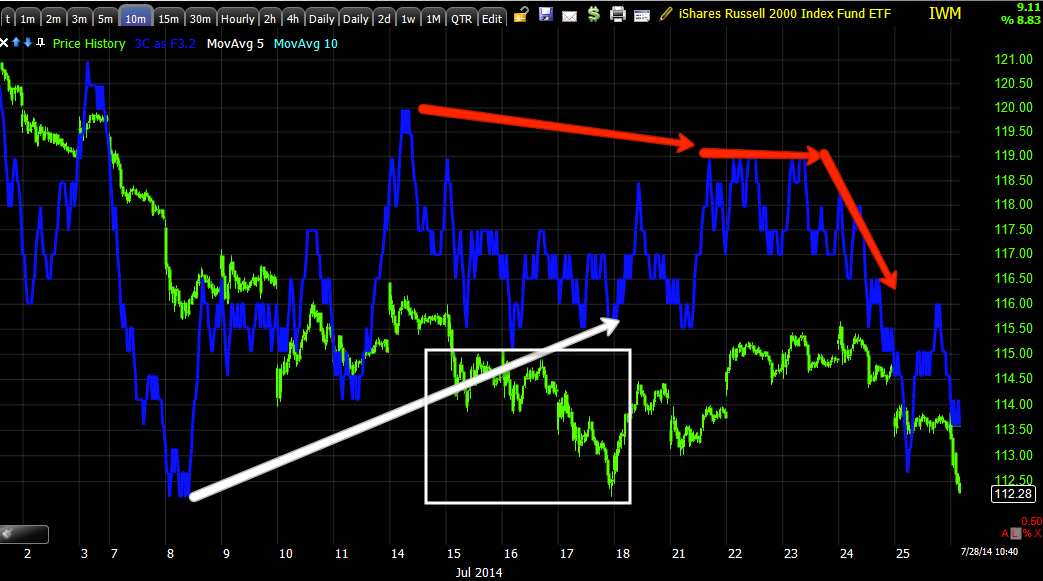
It looks like the weakness from the IWM 10 min chart's positive divegrence which essentially gave out is now manifesting in the market. It does look like some macro-economic releases may be effecting the market now as well, which is not to say it hasn't happened before, just in this case the market is much more sensitive and quicker to discount than any time I've seen over the last 5 years.
The original IWM 10 min positive that led us to forecast a bounce last week and the subsequent weakness from the moment the bounce started.
The 5 min chart was already quite negative, it is moving in line confirming the downside now.
QQQ 3 min in line, but note a small negative this morning in addition, likely on PMI services soft employment and Pending Home Sales worst print/miss of 2014.
SPY 10 min overall weakness from last week
And 2 min in line this morning.
There's a small 1 min positive that may lead to either a consolidation or if some longer charts like 2 min join, it could lead to an intraday bounce/correction
Is interest rates about to start going up?
-
Yes, I know - it does not make any sense - FED is about to cut
rates...but....real world interest rates are not always what FED wants it
to be.
6 years ago


No comments:
Post a Comment