The day was characterized by a lot of volatility, futures were down overnight on the Italian triple dip recession as well as poor eco-data from Germany and the UK with Bunds hitting record low yields as the flight to safety trade was on.
The US opened to a 13 month low in 10-year yields at 2.3%...

Treasuries in general acted a bit strange compared to what I was seeing in the 3C charts (intraday) of the averages.
For example...

Speaking of which, you may recall about a year or so ago when I was tracking the ROC of the carry pairs looking for the exit of smart money from the carry trade they use to leverage up their AUM in a risk on environment. You may know that to close a carry trade, it's basically the reverse of opening one (borrowing/selling low yielding currencies like the Yen and buying higher yielding like the AUD or USD), thus we look for selling in the $USD (which can be difficult to tell why) and the purchase/return of the Yen which is what I stated back in April of 2013 in "Currency Crisis", most specifically to look for a rising Yen around the same time of a falling stock market.
Today's "What the Heck" moment came with the fall of the $USD around 12:15 p.m. as over $3 bn notional of Yen was purchased sending the green back lower which looked like this...

This is around the same time we started getting unusual 3C readings as they had opened on strong intraday positive divergences
carrying over from the last 2.5 hours of trade yesterday.

#2 exceptionally strong leading positive during the last 2-2.5 hours yesterday afternoon. As you know and have seen numerous times, 3C divergences on the averages and equities (although not Index futures) will pick up where they left off the next trading day (even over a 3-day weekend) which is what we saw on the gap down open as 3C was in leading positive position on the open sending the market higher and filling the gap plus some.
#3, which looks like a small stop run (I'm guessing this was an SPX 100-day moving average stop run-see charts below ).
#4 a negative 3C intraday divegrence just before the $USD dump.
#5 3C is in line with price which is not unusual, but...
#6 3C is leading negative intraday.
The 2 min chart doesn't look much better, but it hasn't migrated to the 3 min chart, thus I think a little patience is worthwhile. The IWM looked similar, the SPY showed 3C relative out-performance and the DIA was in line intraday and leading positive both on 2 and 3 min charts which only adds to the confusion...

In addition, as I was trying to express, it's not generally wise to make longer term decisions or forecasts based on short term events, thus whenever I'm having a difficult time with short term timeframes I look to the longer term trend that reduces noise, such as this DIA 5 min leading positive divegrence which is still very much in line with the bounce forecast for this week from last Friday,

SPX & 100-day moving average


Not to stray too far, but UNG long, which we entered July 31st, Trade Idea: (Swing Trade +) UNG / UGAZ and expected to bounce this week as of last Friday, UNG Should Lift Off Next Weeklooks as if its reversal process (nearly textbook) is over and the mark-up (stage 2 in this smaller cycle) is underway with a +1.26% gain today and our UGAZ long at a +13.30% gain.

Our HLF Short which we just added to on July 22nd, Adding 25% to HLF Short Position is up +22.5%, however it looks like it's near a bounce which should be useful to bring the 75% position size up to a full position size, I'm looking to add in the area of $61.50-$66.30 (it's a wide gap). I'll cover this in more detail tomorrow, however as a core short, this one is doing excellent and is a textbook example of our H&S top entry and add to areas which can also be seen in a recent update from July 30th, HLF Position Follow Up.
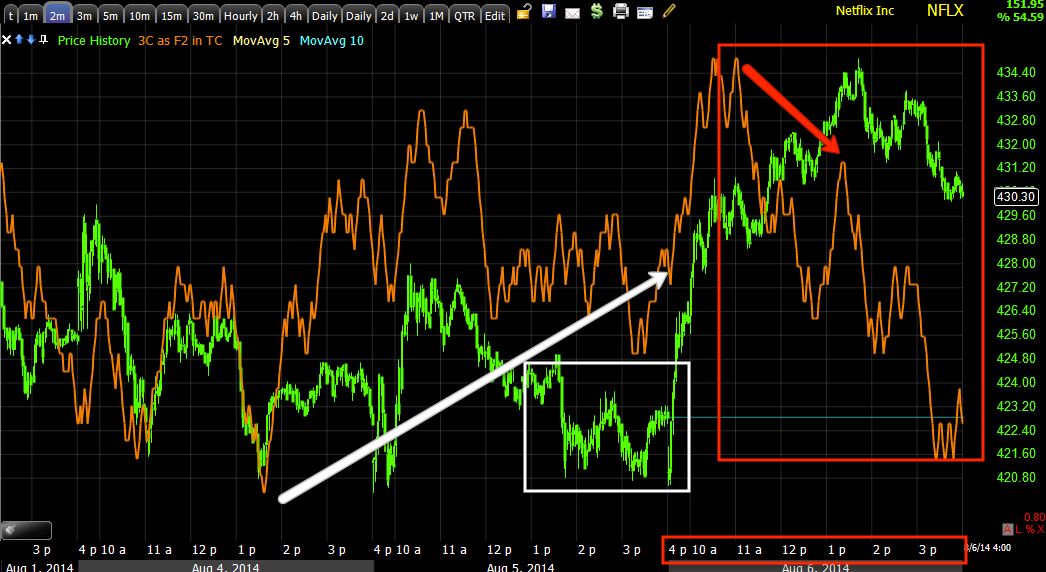
Our NFLX core short is doing well, but I suspected we'd have a second chance shorting opportunity or add to on a bounce which I played with NFLX 8/16 $420 calls that are up +9.5%. Looking at NFLX today, it reminded me of the broad intraday market action as well as a number of individual stocks and industry groups, which almost caused me to close the call position, again this is not my norm to let them run this long.


Transports are now down the most in 6 months, we entered the short position in IYT on July 25th at $150.85 which is just off the all-time closing high of $151.62, Trade Idea: (Longer Term) IYT Short as Transports set up a head fake move above a bearish ascending wedge. Today Transports added another +.60% to our equity short currently at a +4.95% gain as we entered just off the all time high. Today like so many other assets, transports ended the day with a bullish (short term) Star candlestick on increasing volume making it a likely bounce candidate which is good as I have room to add to the position. What is odd about today is the intraday charts depicted some worrying weakness for our bounce forecast, however the daily charts taken by themselves look very much in line with a bounce.
For example, the SPX closed at a minor loss of -0.01%, but formed a bullish Star closing candle and at 100-day support which was cleared of stops early this morning. The SPX also formed a bullish short term candlestick reversal called a "Tweezer Bottom"...

However, on a daily chart basis, this looks very much like an upside bounce is more than ready to go.
The Dow has a similar chart pattern (+0.05% today), also with a bullish candlestick reversal Star and a bullish reversal "Tweezer Bottom".

The Russell ended the day with a gain of +.44% with several opportunities today to take the IWM calls off at a significant gain (which I should have done considering expiration). The NDX closed down a mere -0.03%, the IWM being the out-performer and Transports being the weakest on the day.
Speaking of the SPX and the recent topic of High Yield Credit outflows which I covered July 30th , High Yield Credit (HYG) Heavy Distribution, and some very recent (Weekly/Monday) small inflows which I mentioned this morning in A.M. Update and suspect they are there as part of a short term bounce trade, the S&P has just seen the largest outflows since 2008!
While on the subject of macro outflows, short term/small inflows into HY credit this week and my earlier post today showing some massive intraday deterioration in High Yield Corporate Credit posted this afternoon in Market Update, lets take a look at the market moving lever, HYG.


Gold, Silver and as expected, GDX (Trade Idea (Speculative Very Short Term) GDX Calls) were all higher on the day, even before the $USD dump.
USO was down -0.61%, however as posted today, USO Bounce , I expect a modest bounce in oil.

As mentioned earlier, Treasuries saw a large "Flight to Safety" bid on the open with 10-year yields hitting 13 month lows at 2.30% which were short lived. In what seems like a move away from safety and toward risk, Treasuries spent the rest of the day selling off (rising yields). There could be several reasons for this, but again, looking at the longer term trend for our bounce, we still have solid divergences for the moment.


I still have to stick with the short term higher probabilities despite today's whacky trade signals. Again, based on what I can observe, my "Guess" is for an early run below the SPX's 100-day m.a., shaking out longs and pulling in shorts which is a head fake move that leads to upside reversal momentum so long as any such shakeout can be confirmed with intraday positive divergences.
Other than that, the Dominant Price/Volume Relationship for the averages' component stocks was the most bearish at Close Up/Volume Down. This often leads to next day weakness, however I think we are seeing the broader macro trend in these readings and perhaps they shouldn't be taken for such short term indications.
Of the 9 S&P sectors, 4 closed green with the defensive Utilities being the worst performer, again a short term indication of a bounce.
Of the 239 Morningstar Industry/Sub-Industry groups I track, 137 closed green which is FAR better than yesterday's abysmal reading of 32 green of 239.
Of my Breadth indicators, most were almost completely unchanged from yesterday, however some are worse such as the MCO Summation Index at a reading of nearly -1500 (this is a trend since July 1st).
The percentage of NYSE stocks above their 40-day moving averages improved marginally to a mere 22.5% from yesterday's 20%! As I said, breadth indicators were little changed.
While I'm not specifically talking about near term possible bounce action, breadth indicators are at the worst levels I've seen in 15 years, surpassing the horrible levels of the 2007 top, this is horrendous breadth that is worse in many cases right now than what is observed in a full-blown bear market so ANY price strength in to any of our short set-ups should be considered while giving yourself enough room on a stop to let the position work as volatility will likely increase. You don't need to know the probabilities anymore, they are solid, you need enough time to survive volatility to let positions work. As Jesse Livermore (World's Greatest Trader) once said, "DON'T GIVE ME TIMING, GIVE ME TIME".
I can't wait to see how our MCP long reacts with some 66 million shares short on tonight's announcement of the financing that we suspected was behind the long/strong positive divergence.


No comments:
Post a Comment