With an overall 15 min positive divegrence the size of XLF's (Financials), I don't mind sitting through some normal pullbacks, that's just the game.

For me an XLF long is not the right tool to play a move like this which could be considered a swing long and may even make a new high as I had hoped to see in XLF, crossing above the range resistance where I'd really like to open an XLF short using FAZ (3x short XLF).
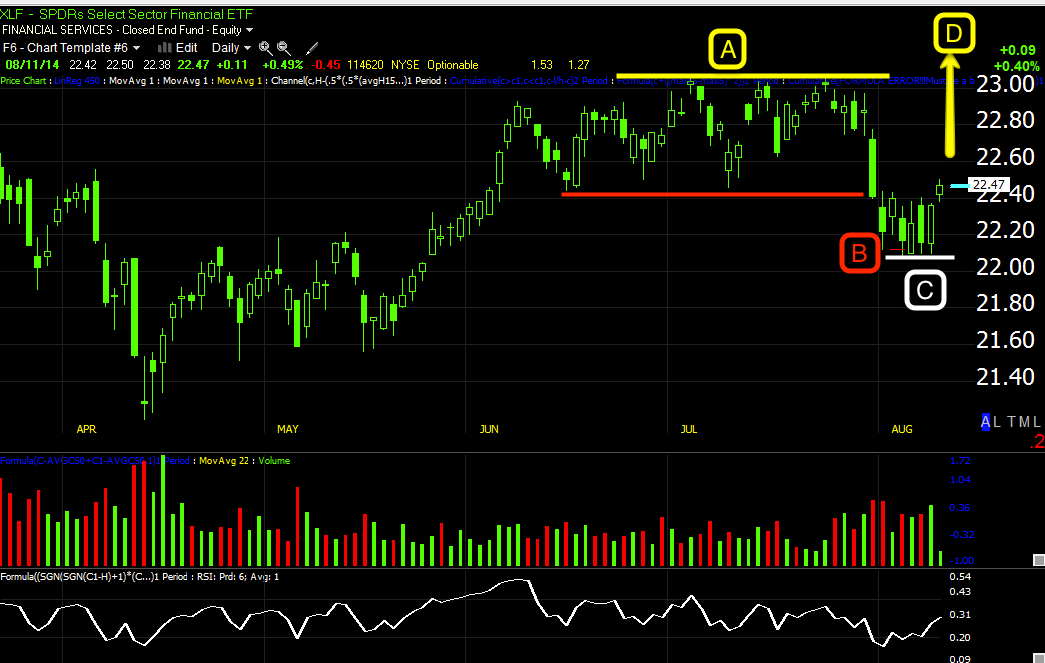
In essence, support and resistance are fairly clear in the range area, a break below support triggers stops and causes new shorts to enter, both are sellers, thus providing the kind of supply at cheap levels Wall St. needs to accumulate for a bounce. The move ABOVE the range's resistance stops out the new shorts and brings in new longs who are still buying the "Buy the Dip" mentality although the reason for "BTD" is long gone which was F_E_D accommodative policy which they are backing out of. This sets up another head fake move or "Bull trap" with plenty of demand to sell in to or short in to as shorts are forced to cover and new longs are buying, again, both creating demand which Wall St. needs in the size they trade.
"D" is where I want to add FAZ back, but I'll let the market tell me where and when, that's just my expectation.
As for the calls just closed, they are a great hedge for the open shorts I'll keep in place as I want the bulk of my positions aligned with the highest probabilities which are very much to the downside. In fact these option trades have not only hedged the shorts, but have been allowing me to add portfolio gains of about +20% on a rolling 30-day basis (remember I have a high risk tolerance and typically only trade 6-8 positions at a time). A weekly call that looks to be about ready to come down is not the best tool for the trip from "C" to "D". I can and would prefer to move in and out of these calls, but for someone who prefers to do less trading, my second favorite position would be a FAS (3x long Financials) ETF which I think you can pretty much safely sit in without trading around normal market moves.
Of course there are numerous ways to play this or just sit it out and wait for the larger set up, "Short XLF/Financials at D".
This is just about the right tool for the job according to how you trade/invest.


The cost basis was $.37 and the fill was $.51 for a P/L of +37.8%, but this was more about capturing those gains and re-entering a new position, maybe with a longer expiration or perhaps even FAS on a pullback. The TICK chart also looked like an intraday pullback (that we expected based on Friday's closing 3C charts)...

Right now XLF and several of the averages look like they'll see that early week/Monday pullback I suspected we'd see on Friday based on the 3C closing charts.
If I can re-enter a new long at a better price, less risk and get to keep the gains just booked, all the better. If not, my eye is really on the prize of a core short XLF position around area "D", that's the real trade here, everything else is just hedging and a few extra $.


No comments:
Post a Comment