Here are the charts for IBB (NASDAQ Biotech Index) and the asset I prefer, BIS (long), 2x short NASDAQ Biotech Index.
This is the 60 min IBB (NASDAQ Biotech Index) as opposed to the 2x short, BIS which I'll be comparing to save some charts. This looks like a double top , you can see the strong distribution at the first top and the accumulation between and an even stronger leading negative divegrence at the second top.
I suspected after Yellen had come out and said "There's no bubble in the equity market except biotechs and social media stocks" (paraphrased), we'd likely see a biotech rally which would enable any longs to let go of their shares in to better prices, rather than what most people assume, an all out, instantaneous panic,
this is why I wanted to wait on the second half of the BIS position.
We also have some interesting post European close weakness mentioned earlier. Although in the week ahead post from Friday my expectation was for more of the same which is largely lateral chop which is getting more volatile, that doesn't mean I expect underlying flow/signals to remain the same, especially if we are to enter stage 4 this week.
For instance, this QQQ 5 min chart is showing quite a bit of weakness not only through the trend, but today specifically.
While the BIS position is not in direct response to the weakness in the market today, it does have a little influence on the one issue I had with bringing BIS up to full size rather than 3/4 size and wait, that was the daily chart. With today's additional weakness on top of everything else, it does have some influence on my decision, but I wouldn't be considering BIS if it wasn't standing on its own two feet.
Note the leading negative 5 min divegrence from today only thus far between the two red hash marks.
Earlier today we had a nasty NYSE intraday TICK extreme of about -1400, since then two more extremes have come in at -1650 and nearly -1700, these are the kind of extremes rarely seen, in fact last week we started seeing some crazy readings I haven't seen before near -2000. As a reminder, the TICK is the number of NYSE advancing issues less declining issues and anything < > +/- 1000 is a strong reading, at 1250 extreme.
You saw the IBB 60 min leading negative, this is BIS, the 2x leveraged inverse ETF with a leading positive 30 min chart (60 min as well, but I'm trying to show the most timeframes and confirmation with the fewest charts).
IBB, the NASDAQ Biotech Index's 10 min chart wwent negative and leading at the recent highs.
While BIS's 5 min chart is leading positive in a rounding reversal area.
Shorter term IBB's 3 min chart is leading negative as well...
As is the intraday 1 min chart, which I'm less concerned with and more concerned with the 5 min -60 min charts.
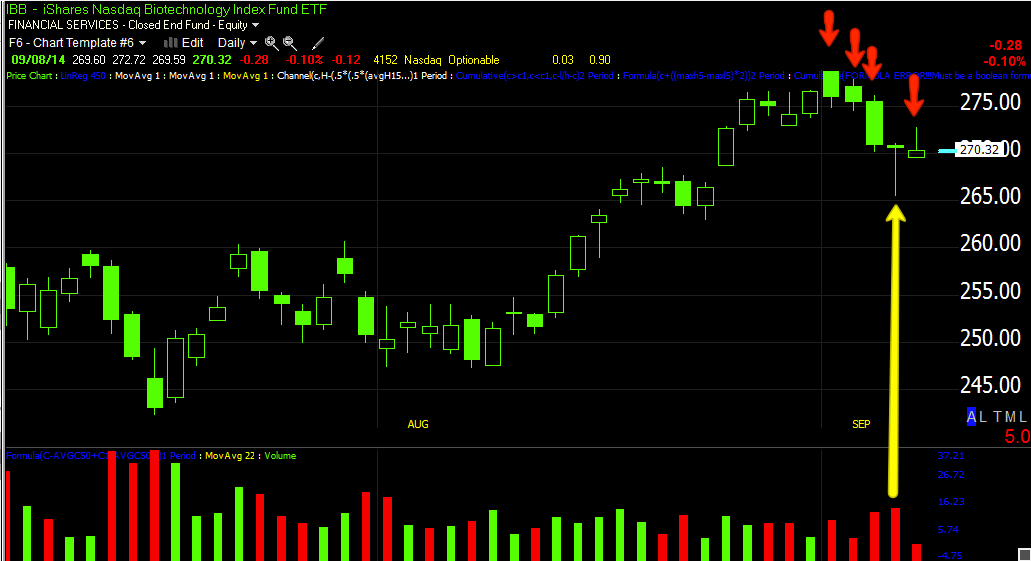
This daily IBB chart and the hammer put in on Friday on increasing volume is a bullish reversal, there's no implied target, in fact all the hammer does is say that the current trend (down) is likely to halt, but there are 3 trends, down , up and lateral, so while we usually think of a hammer as being an upside reversal (with no target, it could be a day or a month), the fact is literally it's just telling us that the trend in effect is going to change (and again we don't know for how long), which means lateral or a consolidation is a possibility as well.
Today's daily candle is not looking very good with a long upper wick and a very small body and the fact is, even if it were to bounce to a new high from here, I'd be looking at 3% drawdown which is really nothing , especially in perspective of the longer term position trade.
This is where I had to take today's 3C weakness and TICK weakness in the market overall and the NASDAQ in specific, in to account.


No comments:
Post a Comment