If you saw last night's post, XLF was referenced as a bellwether for the August rally way back in early August, actually I had been waiting for this positioning before we even knew about the August cycle or start of a base on 8/1.
Last night I put in the actual posts showing where I was expecting XLF to move to and essentially with that, where I expected the August cycle/rally to top out at.
This is what it looked like more or less...
While XLF was in the range, I had been waiting to fill out a partial FAZ long (3x short Financials) on a break above the range. As XLF broke below the range I did not add to FAZ as the resistance/upper range was just too juicy not to be hit, this was also around the time we started getting breadth oversold readings and initial positive divergences for the first week of August which was the base that fueled this entire move so as posted well over a month ago and reposted last night, a move ABOVE the range in XLF was a kind of bellwether for the general market target and
where I've wanted to add to FAZ and fill out what is essentially the core of my short position, not to say other stocks won't come up or perhaps even better positioning in FAZ won't come up, but this is what I was looking for, the reversal process has been sufficient in time and breadth is breaking. I don't need to temp fate any longer over a couple percent here or there when I really need to get the core of my short position completed which is what filling out FAZ long will do.
This si also a good example of how a head fake move creates the momentum to do what XLF could not do in the range, a Crazy Ivan on a larger scale around the rectangle range.
The longer term 4 hour XLF chart is a clear strategic reason of why I want exposure in financials on the short side.
Closer to home within the reversal process area, the 15 min chart has seen sharp deterioration and in the past, this is the kind of chart I would not ignore.
Since the early August base area for the broad market, you can see the intraday 3 min trend from accumulation to distribution in to higher prices/demand.
The 2 min chart shows the same.
On a very short term basis...
The 1 min chart has been leading negative and I don't see any kind of positive divegrence that should cause me to wait on adding the rest of the FAZ position, in fact, it's the opposite.
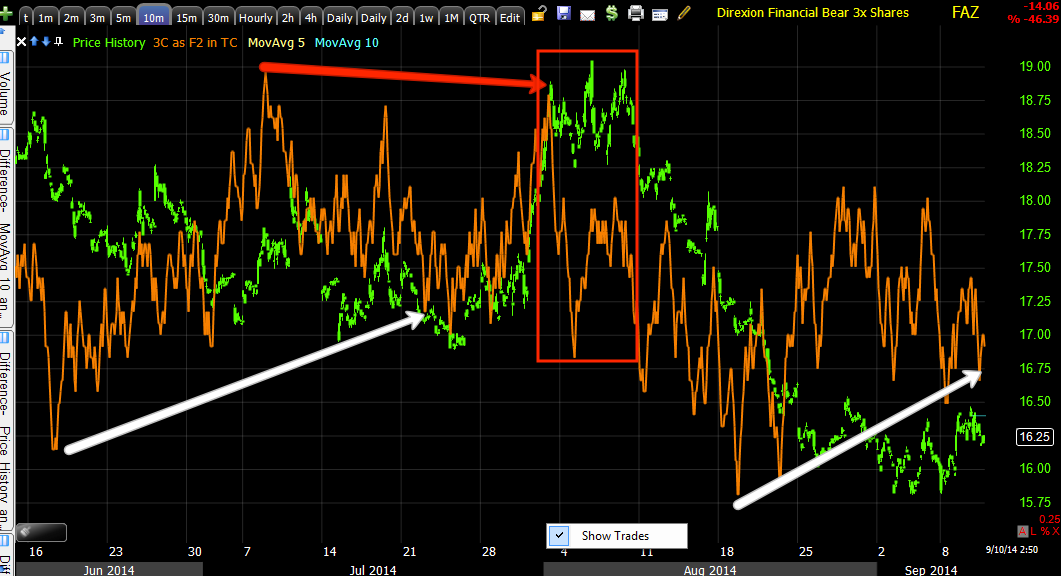
FAZ on the other hand, 3x short financials (long), has a beautiful 15 min chart showing where the August base formed with a negative divegrence, but not a very big one and what has happened since entering stage 3 for XLF, stage 1 for FAZ.
On a more detailed 10 min chart FAZ saw accumulation, a move higher which I suspect was knocked down to accumulate at lower prices / or allow XLF to be sold at higher prices and the recent positive divegrence in to the lower prices as I would expect to see for confirmation.
I didn't draw on the 5 min chart because I wanted you to be able to pick out the divergence rends yourself, although I did add some hints on the time axis.
Again short term, like XLF, I see no reason not to add to FAZ right now.
I can't say as no one can, that this is the very best entry, but I can say this is the entry that I've waited for patiently for months. I can't ask for much more than that.
I'll be filling out FAZ which puts the core of my short position back in place.


No comments:
Post a Comment