Although this is not the high probability trade I prefer to enter, mostly on the risk/reward ratio side, it still may be enough for me given a few intraday signals and maybe a little more of a parabolic move or something that gives it that extra little edge.
I'm still 90% on board with a near term pullback and I'm still 90% on with that pullback being constructive as in building or finishing building that larger base which just means it can support a larger upside move,
that's the trade I'm most interested in near term, longer term SHORT is all I'm interested in, but perhaps there's a short trade on the pullback that has enough risk/reward ratio to make it worthwhile, it's not about probabilities, it's the risk vs the reward, I usually prefer at least 3x more reward than risk as a bare minimum.
Some of the trades I'm considering would be VXX long (lots of ETFs or calls); TLT long, although I don't see enough reward even using the inverse ETF, TBT and shorting it (as well as poor liquidity in the puts); SPXU; SQQQ, SRTY, FAZ; BIS, or TZA. GLD is also looking interesting for a pullback, although I don't see the same in GDX.
Lets start with Index futures as a quick substitute for the averages...
TF/Russell 2000 futures 5 min are clearly negative, I haven't seen too many assets run opposite a signal like this. In fact, usually the 5 min index future signal is what I use to confirm a short term/swing trade.
The 7 min NQ / NASDAQ 100 futures (
and almost all look the same in each timeframe, I'm just trying to show multiple timeframes and assets in as few charts as possible) were in line and on the move up you can see they are going negative on this stronger timeframe than the 5 min above.
ES / SPX-500 E-Mini Futures on a 15 min chart, so while there's a small negative on the chart reflecting the weakness in the 5 and 7 min charts, it hasn't made a big impact on the 15 min chart,
which falls right in line with a constructive pullback that can be bought (long) after it completes for a move higher, significantly if it makes this base nearly double the size on the pullback.
On 1 min intraday charts, they are not looking good and a pullback looks imminent, this is ES/SPX...
1 min NQ/NDX
1 min TF/R2K
As for Leading Indicators, this is our SPX/RUT Ration and VIX Term Structure (Inversion in white is a typical buy signal) and I'm showing 3 different timeframes (multiple timeframe analysis)...
First in the intraday near term 1 min chart, the recent bottom strength sending the averages up higher is fading, we saw this Friday in the SPX/RUT Ratio as well as the VIX Term Structure falling out of inversion. The divergence should be clear.
A slightly longer 5 min chart shows SPX/RUT Ratio giving a positive signal in to the lows with the VIX term structure moving to inversion (white) buy signal and to the left is the most recent signal short term, the chart above this one, just to give perspective and build the case for a constructive pullback which will help build a bigger, stronger base and ultimately bounce/rally.
And a long term 30 min shows the negative SPX/RUT signal in July lreading to a -4% SPX correction and about an -8% R2K correction in to the first week of August where we saw positive 3C divergences along with a positive SPX/RUT Ratio and VIX Inversion buy signal (white) which led to about a week long base and the August cycle/rally.
We have from left to right a stage 4 decline followed by the early August stage 1 base in to August's stage 2 mark-up or bounce and in to stage 3 top/distribution where the SPX/RUT ration went negative again vs the SPX and that led to stage 4 decline which did as we thought
back in early August when expecting a bounce followed by a new "LOWER LOW".
In to that lower low we have a SPX/RUT positive divergence along with a HUGE VIX Inversion buy signal, a base that seems to be much larger, starting around Oct. 2nd with a move below (head fake) which looks to now be forming a "W" bottom .
In yellow these are my expectations, a pullback to the former pivot lows, a head fake move/stop run just below that followed by stage 2 mark-up through the "W" base and making a substantial rally from there.
Intraday VXX (Short term VIX Futures) fail to make a lower low as the SPX makes a higher intraday high, there's obviously pressure bidding up protection in anticipation of a pullback.
The same is true for spot VIX.
HIO, one of our professional sentiment indicators is going negative intraday after early confirmation.
Our Yields indicator which tens to pull the SPX (green) to it, shows a positive divegrence in white leading to some higher SPX prices (green) and a negative divegrence in to those.
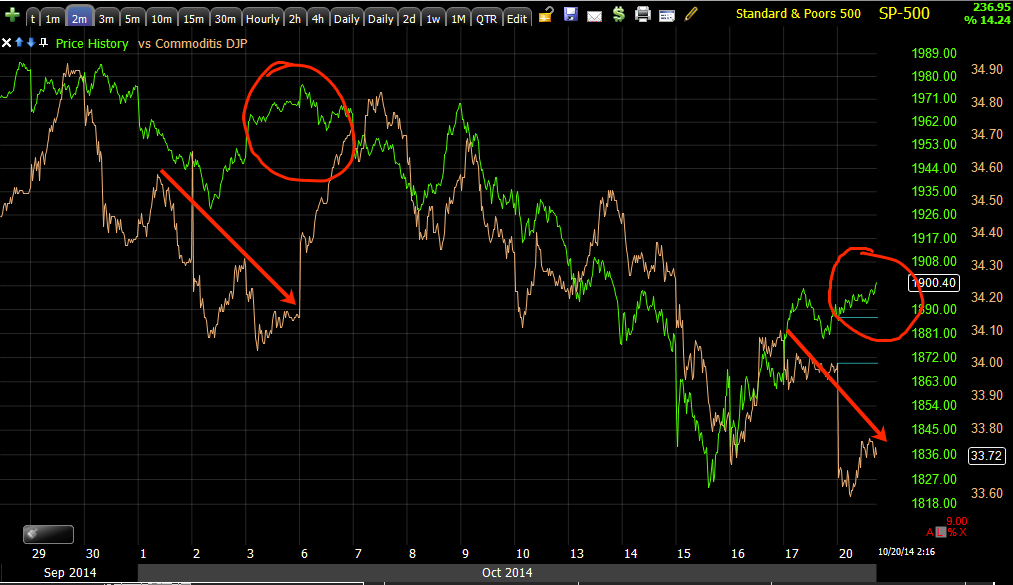
This is commodities (brown) vs the SPX (green), they gave a leading signal (negative) on an SPX bounce, they then continue lower together and right now we have the same exact signal, commodities are not confirming the SPX just like the last time.
The NYSE TICK has been very mellow, I overlaid the SPY (red) on today's action, almost nothing beyond +/- 750 until just recently.
So I'm going to keep watching the 1-3 min charts, that's really where the intraday timing is, the 5 min charts are pretty much set, the Index futures are set for a pullback, HYG's intraday 3C signal is set.
So Again, I'm watching for that risk/reward ratio to improve and make the trade worthwhile as well as the intraday signals and exactly which asset I like the most.


No comments:
Post a Comment